前言:
matplotlib的编程类似于GUI的编程。
各个对象之间的关系和QT的GUI组件widgets之间的关系很相似,QWidgets就是一个QObject的子类—都有一个父类。一个没有父类的窗口部件就会是顶级窗口部件,而一个有父类的窗口就会被包含到它的父类中。
QWidgets调用show()函数之后,将显示这个窗口部件和它的子类部件,而plt.show()也类似这个原理,将figure和其子类的对象全部显示出来。
figure
是最重要的,承载所有子对象,类似于QWidgets的顶级窗口部件。
axes(子区域,坐标轴)
有了figure之后我们需要一个axes(子区域坐标轴)来承载我们要画的图,比如:
- Axes3D():3D axes object.
- matplotlib.axes.Axes(fig,rect):2Daxes object。
The Axes contains most of the figure elements: Axis, Tick, Line2D, Text, Polygon, etc., and sets the coordinate system.
建立一个坐标轴实例在图figure中,其中rect参数用来确定在图中的位置。左边坐标,底部坐标,宽度,高度。例:rect=[0.15,0.1,0.7,0.5]。
绘出的图
有了axes之后,我们就可以在上面画图了,绘出的图像,例如:
1. plot方法,返回一个line2D,lines对象。
2. plot_surface()方法,返回一个surface plot对象。
3. hist()方法,返回一个array,bins,patches【list】。
4. bar()方法,返回一个container [ BarContainer ]。
5. scatter( ) ,返回一个PathCollection对象。
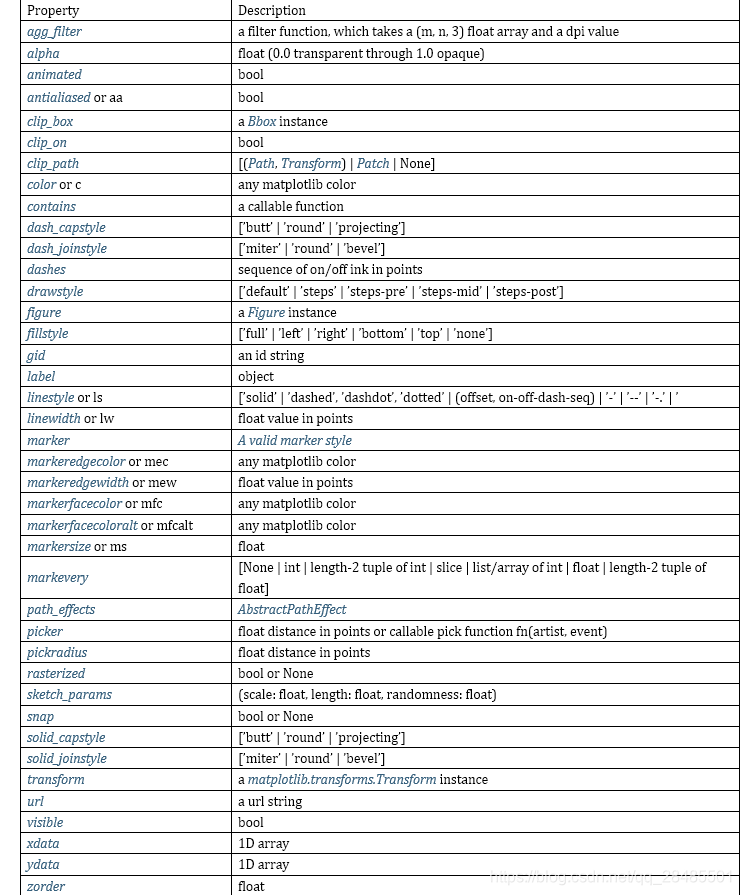
绘出的图的属性和方法
lines
container
class matplotlib.container.Container(kl, label=None)
Bases: tuple
Base class for containers.
Containers are classes that collect semantically related Artists such as the bars of a bar plot.
- add_callback(func)
Adds a callback function that will be called whenever one of the Artist’s properties changes.
Returns an id that is useful for removing the callback with - remove_callback() later. - get_children()
- get_label()
Get the label used for this artist in the legend. - pchanged()
Fire an event when property changed, calling all of the registered callbacks. - remove()
- remove_callback(oid)
Remove a callback based on its id.
See also:
add_callback() For adding callbacks - set_label(s)
Set the label to s for auto legend.
ACCEPTS: string or anything printable with ’%s’ conversion. - set_remove_method(f )
path
class matplotlib.path.Path(vertices, codes=None, _interpolation_steps=1, closed=False,readonly=False)
Bases: object
Path represents a series of possibly disconnected, possibly closed, line and curve segments.
少许方法实例:
- code_type
alias of numpy.uint8 - codes
The list of codes in the Path as a 1-D numpy array. Each code is one of STOP, MOVETO,LINETO, CURVE3, CURVE4 or CLOSEPOLY. For codes that correspond to more than one vertex(CURVE3 and CURVE4), that code will be repeated so that the length of self.vertices andself.codes is always the same. - contains_path(path, transform=None)Returns whether this (closed) path completely contains the given path.
If transform is not None, the path will be transformed before performing the test. - contains_point(point, transform=None, radius=0.0)
Returns whether the (closed) path contains the given point.
If transform is not None, the path will be transformed before performing the test.
radius allows the path to be made slightly larger or smaller. - contains_points(points, transform=None, radius=0.0)
Returns a bool array which is True if the (closed) path contains the corresponding point.
If transform is not None, the path will be transformed before performing the test.radius allows the path to be made slightly larger or smaller. - copy()
Returns a shallow copy of the Path, which will share the vertices and codes with the source Path. - deepcopy(memo=None)
Returns a deepcopy of the Path. The Path will not be readonly, even if the source Path is. - get_extents(transform=None)
Returns the extents (xmin, ymin, xmax, ymax) of the path.
Unlike computing the extents on the vertices alone, this algorithm will take into account the
curves and deal with control points appropriately. - has_nonfinite
True if the vertices array has nonfinite values. - classmethod hatch(hatchpattern, density=6)
Given a hatch specifier, hatchpattern, generates a Path that can be used in a repeated hatching pattern. density is the number of lines per unit square. - interpolated(steps)
Returns a new path resampled to length N x steps. Does not currently handle interpolating curves. - intersects_bbox(bbox, filled=True)
Returns True if this path intersects a given Bbox. filled, when True, treats the path as if it was filled. That is, if the path completely encloses the bounding box, intersects_bbox() will return True.
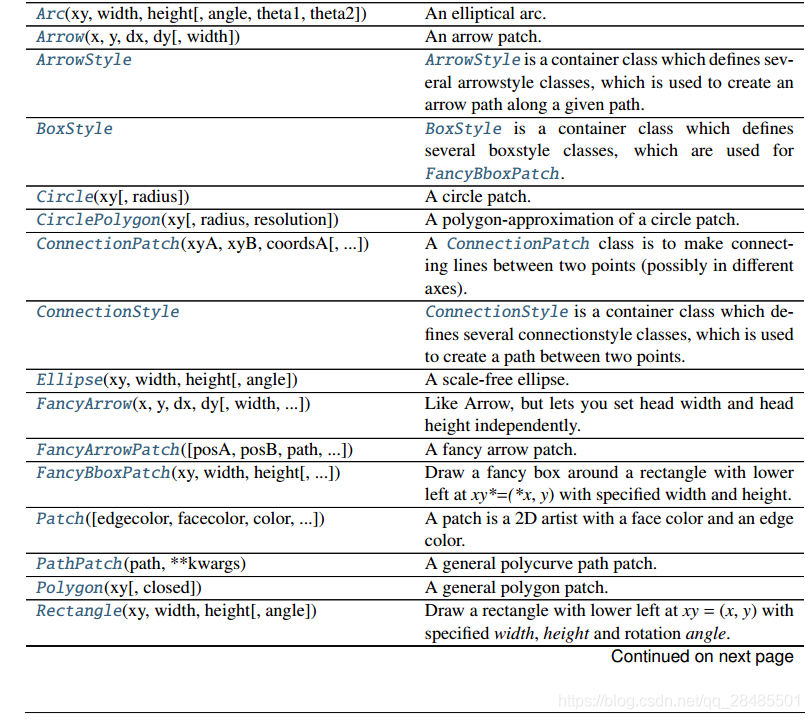
patches
以下的子类如下:
figure下子对象的用法
plt.colorbar(mappable= None,cax = None,ax = None,**kw)
Draw a colorbar in an existing axes.
- 参数mappable是指colorbar应用到的图像或者ContourSet等等(绘出的图)。
- 参数ax是指绘图所在的区域,也就是figure的子区域。