最近工作中遇到一个需求,就是将不同年龄段数据以饼状图或者环状图的形式展示出来。于是利用android自定义的知识封装一个自定义View,方便日后使用,特此记录。
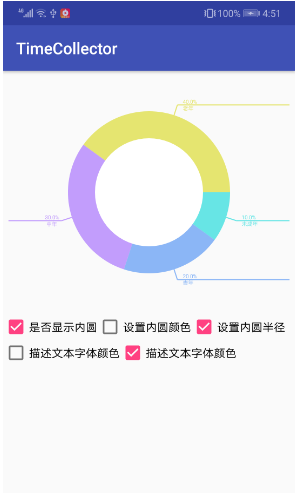
效果图如下
1.饼状图
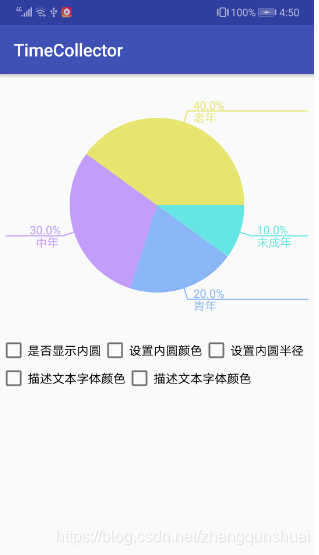
1.环状图
主要强调以下3部分
1.value中添加attr.xml属性文件
2.数据源
3.自定义饼图或者环形图
1.value中添加attr.xml属性文件
value/attr_sector.xml
<?xml version="1.0" encoding="utf-8"?>
<resources>

    <declare-styleable name="SectorView">

        <!-- 圆的半径 -->
        <attr name="min_circle_radio" format="float"/>
        <!-- 内圆的颜色 -->
        <attr name="min_circle_color" format="color"/>

        <!-- 扇形半径 -->
        <attr name="sector_radio" format="float"/>
        <!-- 扇形分几段 -->
        <attr name="sector_part_num" format="integer"/>

        <!--描述文本颜色-->
        <attr name="sector_desc_text_color" format="integer"/>
        <!--描述文本大小-->
        <attr name="sector_desc_text_size" format="float"/>

    </declare-styleable>

</resources>
之所以编写attr.xml文件,原因有二:
(1).为了更直观的了解自定义View涉及到的属性参数,方便管理
(2).在自定义View文件中,封装了一些通用的接口(eg.设置描述文本的字体颜色,内圆的半径和颜色等等),在设置之前,往往会初始化一些默认值。这就用到我们的attr属性了。
2.数据源
public class AgeEntry {

    private int totalPart;
    private int childTotalIn;
    private int youthTotalIn;
    private int middleTotalIn;
    private int oldTotalIn;

    public int getChildTotalIn() {
        return childTotalIn;
    }

    public void setChildTotalIn(int childTotalIn) {
        this.childTotalIn = childTotalIn;
    }

    public int getYouthTotalIn() {
        return youthTotalIn;
    }

    public void setYouthTotalIn(int youthTotalIn) {
        this.youthTotalIn = youthTotalIn;
    }

    public int getMiddleTotalIn() {
        return middleTotalIn;
    }

    public void setMiddleTotalIn(int middleTotalIn) {
        this.middleTotalIn = middleTotalIn;
    }

    public int getOldTotalIn() {
        return oldTotalIn;
    }

    public void setOldTotalIn(int oldTotalIn) {
        this.oldTotalIn = oldTotalIn;
    }

    public int getTotalPart() {
        return totalPart;
    }

    public void setTotalPart(int totalPart) {
        this.totalPart = totalPart;
    }

    @Override
    public String toString() {
        return "AgeEntry{" +
                "totalPart=" + totalPart +
                ", childTotalIn=" + childTotalIn +
                ", youthTotalIn=" + youthTotalIn +
                ", middleTotalIn=" + middleTotalIn +
                ", oldTotalIn=" + oldTotalIn +
                '}';
    }
}
待展示的数据,你完全可以按照自己的需求去定义。这些数据最终都需要你去换算成占比,用于图形的绘制。
3.自定义饼图或者环形图(完整文件)
public class SectorView extends View {

    private static final String TAG = "SectorView";

    //圆心坐标
    private int mHeight, mWidth;
    private int centerX, centerY;

    //画笔
    private Paint mPaint;
    private Paint mTextPaint;

    //描述文本
    private float mDescTextSize;
    private int mDescTextColor;

    //内圆
    private float mMinCircleRadio;
    private int mSectorNum;

    //扇形
    private int mMinCircleColor;
    private float mSectorRadio;

    //是否显示里面的圆
    private boolean isShowInnerCircle = false;

    //数据
    private float[] mAgeLevelPercent = new float[4];
    private String[] mAgeDesc = new String[4];

    //age年龄段对应的颜色
    private int[] mAgeColors = {
            Color.parseColor("#67E5E5"),
            Color.parseColor("#8BB6F6"),
            Color.parseColor("#C29DFC"),
            Color.parseColor("#E5E570"),
    };


    public SectorView(Context context) {
        super(context, null);
    }

    public SectorView(Context context, AttributeSet attrs) {
        super(context, attrs);
        init(context, attrs);
    }

    private void init(Context context, AttributeSet attrs) {

        TypedArray a = context.obtainStyledAttributes(attrs, R.styleable.SectorView);
        //里面圆半径,默认200f
        mMinCircleRadio = a.getFloat(R.styleable.SectorView_min_circle_radio, 120f);
        //里面圆的颜色,默认白色
        mMinCircleColor = a.getColor(R.styleable.SectorView_min_circle_color, Color.parseColor("#ffffff"));

        //扇形半径,默认300f
        mSectorRadio = a.getFloat(R.styleable.SectorView_sector_radio, 300f);
        //扇形分几段
        mSectorNum = a.getInt(R.styleable.SectorView_sector_part_num, 4);

        mDescTextSize = a.getFloat(R.styleable.SectorView_sector_desc_text_size, 40f);
        mDescTextColor = a.getInt(R.styleable.SectorView_sector_desc_text_color, Color.parseColor("#000000"));

        mPaint = new Paint();
        mPaint.setStrokeCap(Paint.Cap.ROUND);
        mPaint.setAntiAlias(true);

        mTextPaint = new Paint();
        mTextPaint.setTextSize(40f);
        mTextPaint.setStrokeWidth(3);
        mTextPaint.setAntiAlias(true);
        mTextPaint.setColor(Color.BLACK);
    }


    @Override
    protected void onMeasure(int widthMeasureSpec, int heightMeasureSpec) {
        super.onMeasure(widthMeasureSpec, heightMeasureSpec);
        mHeight = MeasureSpec.getSize(heightMeasureSpec);
        mWidth = MeasureSpec.getSize(widthMeasureSpec);
    }

    @Override
    protected void onDraw(Canvas canvas) {
        super.onDraw(canvas);
        centerX = (getRight() - getLeft()) / 2;
        centerY = (getBottom() - getTop()) / 2;
        int min = mHeight > mWidth ? mWidth : mHeight;
        if (mSectorRadio > min / 2) {
            mSectorRadio = (int) ((min - getPaddingTop() - getPaddingBottom()) / 3.5);
        }
        canvas.save();
        drawCircle(canvas);
        canvas.restore();

        canvas.save();
        drawLineAndText(canvas);
        canvas.restore();
    }


    /**
     * 绘制线与文本
     *
     * @param canvas
     */
    private void drawLineAndText(Canvas canvas) {
        int start = 0;
        canvas.translate(centerX, centerY);
        mTextPaint.setStrokeWidth(4);

        for (int i = 0; i < mSectorNum; i++) {
            float angles = mAgeLevelPercent[i] * 360;
            drawLine(canvas, start, angles, mAgeDesc[i], mAgeColors[i]);
            start += angles;
        }
    }

    /**
     * 绘制线和文字
     *
     * @param canvas
     * @param start  绘制的起始角度
     * @param angles 数据块占用的角度(扫过的扇形弧度)
     * @param text   待绘制的描述文本
     * @param color
     */
    private void drawLine(Canvas canvas, int start, float angles, String text, int color) {
        mTextPaint.setColor(color);

        //参照数学公式::b = c *Math.cos(Math.toRadians(A)),其中Math.toRadians(A)::角度转换成弧度
        float startX, startY;
        startX = (float) ((mSectorRadio - 20) * Math.cos(Math.toRadians(start + angles / 2)));
        startY = (float) ((mSectorRadio - 20) * Math.sin(Math.toRadians(start + angles / 2)));

        //折线的终点
        float stopX, stopY;
        stopX = (float) ((mSectorRadio + 40) * Math.cos(Math.toRadians(start + angles / 2)));
        stopY = (float) ((mSectorRadio + 40) * Math.sin(Math.toRadians(start + angles / 2)));
        canvas.drawLine(startX, startY, stopX, stopY, mTextPaint);

        //绘制横线
        int endX;
        if (stopX > 0) {//判断横线是画在左边还是右边
            endX = (centerX - getPaddingRight() - 20);
        } else {
            endX = (-centerX + getPaddingLeft() + 20);
        }
        canvas.drawLine(stopX, stopY, endX, stopY, mTextPaint);

        int dx = (int) (endX - stopX);//判断文本绘制在左边还是右边

        //测量文字大小
        Rect rect = new Rect();
        mTextPaint.getTextBounds(text, 0, text.length(), rect);
        int w = rect.width();
        int h = rect.height();
        int offset = 20;//文字在横线的偏移量
        canvas.drawText(text, 0, text.length(), dx > 0 ? stopX + offset : stopX - w - offset, stopY + h, mTextPaint);

        //测量百分比大小
        String percentage = angles / 3.60 + "";
        //控制百分比的位数
        percentage = percentage.substring(0, percentage.length() > 4 ? 4 : percentage.length()) + "%";
        mTextPaint.getTextBounds(percentage, 0, percentage.length(), rect);
        w = rect.width() - 10;

        //绘制百分比
        canvas.drawText(percentage, 0, percentage.length(), dx > 0 ? stopX + offset : stopX - w - offset, stopY - 5, mTextPaint);
    }

    /**
     * 绘制扇形
     *
     * @param canvas
     */
    private void drawCircle(Canvas canvas) {
        RectF rect = new RectF((float) (centerX - mSectorRadio), centerY - mSectorRadio,
                centerX + mSectorRadio, centerY + mSectorRadio);
        int start = 0;
        for (int i = 0; i < mSectorNum; i++) {
            float angles = (mAgeLevelPercent[i] * 360);
            mPaint.setColor(mAgeColors[i]);//mAgeColors.length:::5
            canvas.drawArc(rect, start, angles, true, mPaint);
            start += angles;
        }

        //显示内圆
        if (isShowInnerCircle) {
            mPaint.setColor(mMinCircleColor);
            canvas.drawCircle(centerX, centerY, mMinCircleRadio, mPaint);
        }

    }

    /**
     * 是否显示里面的圆
     *
     * @param isShowInnerCircle
     */
    public void showInnerCircle(boolean isShowInnerCircle) {
        this.isShowInnerCircle = isShowInnerCircle;
        invalidate();
    }

    /***
     * 设置里面的圆的颜色
     * @param color
     */
    public void setInnerCircleColor(int color) {
        mMinCircleColor = color;
        invalidate();
    }

    /***
     * 设置里面的圆的半径
     * @param radio
     */
    public void setInnerCircleRadio(float radio) {
        mMinCircleRadio = radio;
        invalidate();
    }

    /***
     * 设置数据块文本描述的字体大小
     * @param textSize
     */
    public void setDescTextSize(float textSize) {
        mDescTextSize = textSize;
        mTextPaint.setTextSize(mDescTextSize);
        invalidate();
    }

    /***
     * 设置描述文本的颜色
     * @param color
     */
    public void setDescTextColor(int color) {//todo:目前描述文本的颜色和扇形颜色是一致的
        mDescTextColor = color;
        mTextPaint.setColor(color);
        invalidate();
    }

    /***
     * 设置扇形的半径大小
     * @param mSectorRadio
     */
    public void setSectorRadio(int mSectorRadio) {
        this.mSectorRadio = mSectorRadio;
        setDescTextSize(mSectorRadio / 6);
        invalidate();
    }

    /***
     * 设置数据
     * @param entry
     */
    public void setData(AgeEntry entry) {
        int childTotalIn = entry.getChildTotalIn();
        int youthTotalIn = entry.getYouthTotalIn();
        int middleTotalIn = entry.getMiddleTotalIn();
        int oldTotalIn = entry.getOldTotalIn();

        Log.d(TAG, " childTotalIn::" + childTotalIn + "  youthTotalIn::" + youthTotalIn + "  middleTotalIn::" + middleTotalIn + " oldTotalIn::" + oldTotalIn);
        int total = childTotalIn + youthTotalIn + middleTotalIn + oldTotalIn;
        mAgeLevelPercent[0] = (float) childTotalIn / total;
        mAgeLevelPercent[1] = (float)youthTotalIn / total;
        mAgeLevelPercent[2] = (float)middleTotalIn / total;
        mAgeLevelPercent[3] = (float)oldTotalIn / total;

        mAgeDesc[0] = "未成年";
        mAgeDesc[1] = "青年";
        mAgeDesc[2] = "中年";
        mAgeDesc[3] = "老年";

        for (int i = 0; i < 4; i++) {
            Log.d(TAG, "mAgeLevelPercent[" + i + "]= " + mAgeLevelPercent[i] + "\n" +
                    "mAgeDesc[" + i + "]= " + mAgeDesc[i]);

        }

    }

}
上述自定义View中在绘制扇形图的标签线时候,需要应用的数学知识去确定折线绘制的起点和转折点。数学知识,此处不再赘叙。
//参照数学公式::b = c *Math.cos(Math.toRadians(A)),其中Math.toRadians(A)::角度转换成弧度
实际上,在实现了上述效果饼状图和环形图效果之后,我并没有将其用在项目中去。因为我发现了更好的------MPAndroidChart开源库。
MPAndroidChart非常强大,可以绘制折线图,柱状图,扇形图,饼状图等等,只有你想不到,没有它做不到的。
关于MPAndroidChart的使用推荐下面几个链接.
Android图表库MPAndroidChart(二)——线形图的方方面面,看完你会回来感谢我的
Android图表库MPAndroidChart(七)—饼状图可以再简单一点
等系列。(进去就有收获)
另外,关于MPAndroidChart在折线图和饼图使用一些需要注意的点。
eg:
1.折线图如何避免x轴左右尽头的坐标值被遮挡.
2.饼状图如何显示标签线
后续会拿出来记录一下。