				版权声明:本文为jiarenyf原创文章,未经允许也可以转载,但是附上链接……					https://blog.csdn.net/u011762313/article/details/48851015				</div>
							            <div id="content_views" class="markdown_views">
						<!-- flowchart 箭头图标 勿删 -->
						<svg xmlns="http://www.w3.org/2000/svg" style="display: none;"><path stroke-linecap="round" d="M5,0 0,2.5 5,5z" id="raphael-marker-block" style="-webkit-tap-highlight-color: rgba(0, 0, 0, 0);"></path></svg>
						<ul>
name: "LeNet"

###for data and labels

layer {
  name: "data"
  type: "HDF5Data"
  top: "data"
  top: "labels"
  include {
    phase: TRAIN
  }
  hdf5_data_param {
    source: "list_train.txt"
    batch_size: 100
  }
}
layer {
  name: "data"
  type: "HDF5Data"
  top: "data"
  top: "labels"
  include {
    phase: TEST
  }
  hdf5_data_param {
    source: "list_test.txt"
    batch_size: 100
  }
}
layer {
  name: "slicers"
  type: "Slice"
  bottom: "labels"
  top: "label_1"
  top: "label_2"
  slice_param {
    axis: 1
    slice_point: 1
  }
}

### for all

layer {
  name: "conv_all"
  type: "Convolution"
  bottom: "data"
  top: "conv_all"
  param {
    lr_mult: 1
  }
  param {
    lr_mult: 2
  }
  convolution_param {
    num_output: 50
    kernel_size: 5
    stride: 1
    weight_filler {
      type: "xavier"
    }
    bias_filler {
      type: "constant"
    }
  }
}
layer {
  name: "relu_all"
  type: "ReLU"
  bottom: "conv_all"
  top: "conv_all"
}
layer {
  name: "pool_all"
  type: "Pooling"
  bottom: "conv_all"
  top: "pool_all"
  pooling_param {
    pool: MAX
    kernel_size: 2
    stride: 2
  }
}

### for kind_1

layer {
  name: "ip1"
  type: "InnerProduct"
  bottom: "pool_all"
  top: "ip1"
  param {
    lr_mult: 1
  }
  param {
    lr_mult: 2
  }
  inner_product_param {
    num_output: 2
    weight_filler {
      type: "xavier"
    }
    bias_filler {
      type: "constant"
    }
  }
}
layer {
  name: "accuracy1"
  type: "Accuracy"
  bottom: "ip1"
  bottom: "label_1"
  top: "accuracy1"
  include {
    phase: TEST
  }
}
layer {
  name: "loss_1"
  type: "SoftmaxWithLoss"
  bottom: "ip1"
  bottom: "label_1"
  top: "loss_1"
}

###for kind_2

layer {
  name: "ip2"
  type: "InnerProduct"
  bottom: "pool_all"
  top: "ip2"
  param {
    lr_mult: 1
  }
  param {
    lr_mult: 2
  }
  inner_product_param {
    num_output: 3
    weight_filler {
      type: "xavier"
    }
    bias_filler {
      type: "constant"
    }
  }
}
layer {
  name: "accuracy2"
  type: "Accuracy"
  bottom: "ip2"
  bottom: "label_2"
  top: "accuracy2"
  include {
    phase: TEST
  }
}
layer {
  name: "loss_2"
  type: "SoftmaxWithLoss"
  bottom: "ip2"
  bottom: "label_2"
  top: "loss_2"
}
- 1
- 2
- 3
- 4
- 5
- 6
- 7
- 8
- 9
- 10
- 11
- 12
- 13
- 14
- 15
- 16
- 17
- 18
- 19
- 20
- 21
- 22
- 23
- 24
- 25
- 26
- 27
- 28
- 29
- 30
- 31
- 32
- 33
- 34
- 35
- 36
- 37
- 38
- 39
- 40
- 41
- 42
- 43
- 44
- 45
- 46
- 47
- 48
- 49
- 50
- 51
- 52
- 53
- 54
- 55
- 56
- 57
- 58
- 59
- 60
- 61
- 62
- 63
- 64
- 65
- 66
- 67
- 68
- 69
- 70
- 71
- 72
- 73
- 74
- 75
- 76
- 77
- 78
- 79
- 80
- 81
- 82
- 83
- 84
- 85
- 86
- 87
- 88
- 89
- 90
- 91
- 92
- 93
- 94
- 95
- 96
- 97
- 98
- 99
- 100
- 101
- 102
- 103
- 104
- 105
- 106
- 107
- 108
- 109
- 110
- 111
- 112
- 113
- 114
- 115
- 116
- 117
- 118
- 119
- 120
- 121
- 122
- 123
- 124
- 125
- 126
- 127
- 128
- 129
- 130
- 131
- 132
- 133
- 134
- 135
- 136
- 137
- 138
- 139
- 140
- 141
- 142
- 143
- 144
- 145
- 146
- 147
- 148
- 149
- 150
- 151
- 152
- 153
- 154
- 155
- 156
- 157
- 158
- 159
- 160
- 161
- 162
- 163
- 164
- 165
- 166
- 167
- 168
- 注:如何生成hdf5文件,详见:生成hdf5文件用于多标签训练
- 注:Hdf5Data详见:HDF5 Input
- 注:Slice详见:Slicing
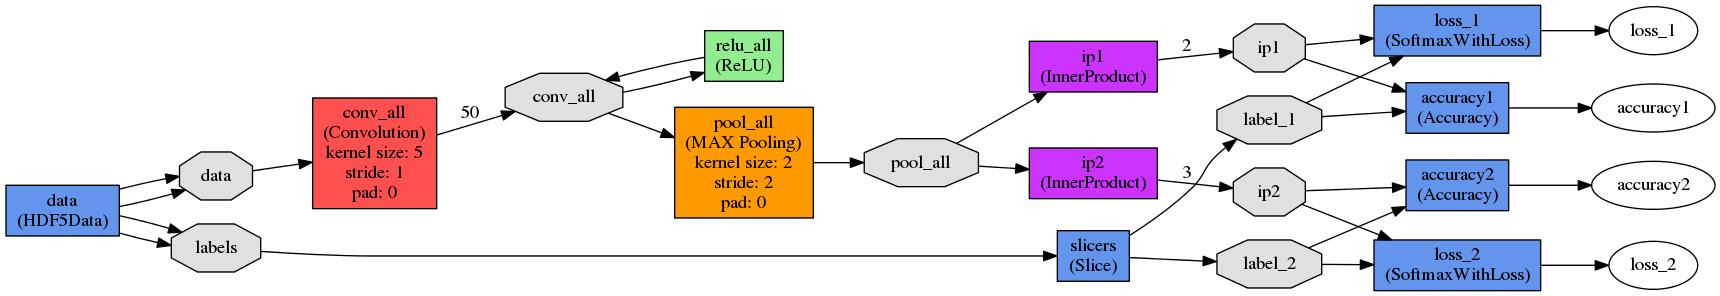
- 最终网络结构如下图:
- 注:Caffe学习:使用pycaffe绘制网络结构
				版权声明:本文为jiarenyf原创文章,未经允许也可以转载,但是附上链接……					https://blog.csdn.net/u011762313/article/details/48851015				</div>
							            <div id="content_views" class="markdown_views">
						<!-- flowchart 箭头图标 勿删 -->
						<svg xmlns="http://www.w3.org/2000/svg" style="display: none;"><path stroke-linecap="round" d="M5,0 0,2.5 5,5z" id="raphael-marker-block" style="-webkit-tap-highlight-color: rgba(0, 0, 0, 0);"></path></svg>
						<ul>