本文以vs2010+qt 编程,安装qwt插件,设计界面如图所示,以正弦信号模拟传感器接收的数据,运行效果如下所示.

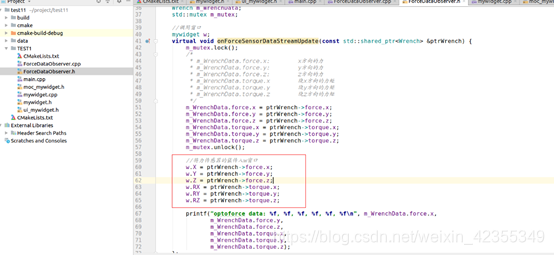
由于力传感器相关软件信号采集只能在ubuntu的Clion下,所以需要将相关文件复制拷贝到其项目中,需要的文件有:

其中moc_xx.cpp改成moc_xx.h, 将其在mywidget.cpp中引用,因为qt编译是用Qmake,而Clion是用Cmake, 如果没加会出现以下错误:

Q_OBJECT未定义,若将Q_OBJECT删掉,则QT基本的信号和槽功能不能实现:

所以必须加上上述文件moc_xx.h,

设计步骤:
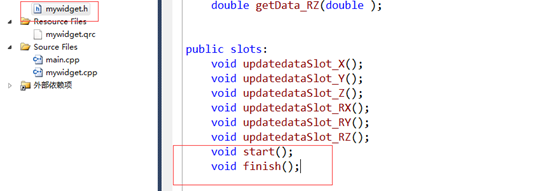
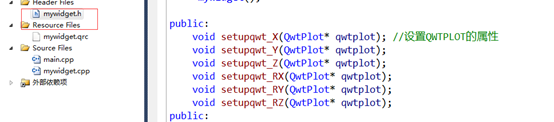
- 参考我的基于vs2010+qt计算器设计界面,添加qwtplot控件,添加开始和结束按钮,分别命好名qwtPlot_X qwtPlot_Y qwtPlot_Z qwtPlot_RX qwtPlot_RY qwtPlot_RZ
- 添加click响应和自定义槽函数start()和finish()


运行即可出现界面
3.重新定义QWTPLOT属性

定义模拟信号的函数Getdata 和更新qwtplot_x的函数,其中updatadataSlot_X()是实时显示动态曲线的关键

在start()里添加connect(),连接信号和槽

此时运行可出现第一张图像
动态显示正弦曲线的相关代码
mywidget.h如下:
#ifndef MYWIDGET_H
#define MYWIDGET_H

#include <QtWidgets/QWidget>
#include "ui_mywidget.h"
#include <QTimer>
#include <QTime>
#include <qwt_plot.h>
#include <qwt_plot_curve.h>
#include <qwt_legend.h>
#include <math.h>
#include <qwt_plot_zoomer.h>
#include <qwt_plot_panner.h>
#include <qwt_plot_magnifier.h>
#include <qwt_plot_grid.h>
#include <qwt_scale_draw.h>

class mywidget : public QWidget
{
	Q_OBJECT

public:
	mywidget(QWidget *parent = 0);
	~mywidget();

public:
	void setupqwt_X(QwtPlot* qwtplot); //设置QWTPLOT的属性
	void setupqwt_Y(QwtPlot* qwtplot);
	void setupqwt_Z(QwtPlot* qwtplot);
	void setupqwt_RX(QwtPlot* qwtplot);
	void setupqwt_RY(QwtPlot* qwtplot);
	void setupqwt_RZ(QwtPlot* qwtplot);
public:

	QVector<double> t_data;
	QVector<double> X_data;
	QVector<double> Y_data;
	QVector<double> Z_data;
	QVector<double> RX_data;
	QVector<double> RY_data;
	QVector<double> RZ_data;


	QTimer updateTimer;

	QwtPlotCurve *curve_X ;
	QwtPlotCurve *curve_Y ;
	QwtPlotCurve *curve_Z ;
	QwtPlotCurve *curve_RX ;
	QwtPlotCurve *curve_RY ;
	QwtPlotCurve *curve_RZ ;

	double getData_X(double );
	double getData_Y(double );
	double getData_Z(double );
	double getData_RX(double );
	double getData_RY(double );
	double getData_RZ(double );


public slots:
	void updatedataSlot_X();
	void updatedataSlot_Y();
	void updatedataSlot_Z();
	void updatedataSlot_RX();
	void updatedataSlot_RY();
	void updatedataSlot_RZ();
	void start();
	void finish();


private:
	Ui::mywidgetClass ui;

};

#endif // MYWIDGET_H
mywidget.cpp如下:
#include "mywidget.h"

mywidget::mywidget(QWidget *parent)
	: QWidget(parent)
{
	ui.setupUi(this);
	setupqwt_X(ui.qwtPlot_X);
	setupqwt_Y(ui.qwtPlot_Y);
	setupqwt_Z(ui.qwtPlot_Z);
	setupqwt_RX(ui.qwtPlot_RX);
	setupqwt_RY(ui.qwtPlot_RY);
	setupqwt_RZ(ui.qwtPlot_RZ);
}

mywidget::~mywidget()
{

}

void mywidget::setupqwt_X(QwtPlot* qwtplot)
{
	//初始化xdata,x对应长度为5的坐标,y初始全为0
	for(int i=1;i<5001;i++)
	{
		t_data.append(double(i)/1000-5);
		X_data.append(0);
	}
	qwtplot->setTitle("The force of X");
	qwtplot->setCanvasBackground(Qt::gray);//背景

	//添加曲线
	curve_X = new QwtPlotCurve();
	curve_X->setPen( Qt::yellow, 1 ); //曲线的颜色 宽度;

	QTime curtime;
	curtime=curtime.currentTime();

	//设置刻度
	qwtplot->setAxisScale(QwtPlot::yLeft,-2,2,1); //设置刻度范围-2到2,间隔是1
	qwtplot->setAxisScale(QwtPlot::xBottom,-5,0,1);

	//设置网格
	QwtPlotGrid *grid = new QwtPlotGrid();
	grid->enableX( true );//设置网格线
	grid->enableY( true );
	grid->setMajorPen( Qt::black, 0, Qt::DotLine );
	grid->attach(qwtplot);

	//时间
	//connect(&updateTimer,SIGNAL(timeout()),this,SLOT(updatedataSlot_X()));
	//updateTimer.start(0);

}
//模拟数据
double mywidget::getData_X(double time)
{
	double s = 2*qCos( time * (M_PI * 2 )+ M_PI/3 ) ;
	return s;
}

void mywidget::updatedataSlot_X()
{
	static QTime dataTime(QTime::currentTime());
	long int eltime = dataTime.elapsed();
	static int lastpointtime = 0;

	int size = (eltime - lastpointtime);


	if(size>0)
	{
		//有数据传入
		X_data.erase(X_data.begin(),X_data.begin()+size);//擦除多余的数据
		for(int i=1;i<size+1;i++)
		{
			X_data.append(getData_X((((double)lastpointtime+i)/1000)));
		}
		lastpointtime = eltime;
	}

	curve_X->setSamples(t_data, X_data);
	curve_X->attach(ui.qwtPlot_X);

	ui.qwtPlot_X->replot();
}

void mywidget::setupqwt_Y(QwtPlot* qwtplot)
{
	//初始化xdata,x对应长度为5的坐标,y初始全为0
	for(int i=1;i<5001;i++)
	{
		t_data.append(double(i)/1000-5);
		Y_data.append(0);
	}
	qwtplot->setTitle("The force of Y");
	qwtplot->setCanvasBackground(Qt::gray);//背景

	//添加曲线
	curve_Y = new QwtPlotCurve();
	curve_Y->setPen( Qt::yellow, 1 ); //曲线的颜色 宽度;

	QTime curtime;
	curtime=curtime.currentTime();

	//设置刻度
	qwtplot->setAxisScale(QwtPlot::yLeft,-2,2,1); //设置刻度范围-2到2,间隔是1
	qwtplot->setAxisScale(QwtPlot::xBottom,-5,0,1);

	//设置网格
	QwtPlotGrid *grid = new QwtPlotGrid();
	grid->enableX( true );//设置网格线
	grid->enableY( true );
	grid->setMajorPen( Qt::black, 0, Qt::DotLine );
	grid->attach(qwtplot);

	//时间
	//connect(&updateTimer,SIGNAL(timeout()),this,SLOT(updatedataSlot_Y()));
	//updateTimer.start(0);

}
//模拟数据
double mywidget::getData_Y(double time)
{
	double s = qCos( time * M_PI * 2 ) ;
	return s;
}

void mywidget::updatedataSlot_Y()
{
	static QTime dataTime(QTime::currentTime());
	long int eltime = dataTime.elapsed();
	static int lastpointtime = 0;

	int size = (eltime - lastpointtime);


	if(size>0)
	{
		//有数据传入
		Y_data.erase(Y_data.begin(),Y_data.begin()+size);//擦除多余的数据
		for(int i=1;i<size+1;i++)
		{
			Y_data.append(getData_Y((((double)lastpointtime+i)/1000)));
		}
		lastpointtime = eltime;
	}

	curve_Y->setSamples(t_data, Y_data);
	curve_Y->attach(ui.qwtPlot_Y);

	ui.qwtPlot_Y->replot();
}


void mywidget::setupqwt_Z(QwtPlot* qwtplot)
{
	//初始化xdata,x对应长度为5的坐标,y初始全为0
	for(int i=1;i<5001;i++)
	{
		t_data.append(double(i)/1000-5);
		Z_data.append(0);
	}
	qwtplot->setTitle("The force of Z");
	qwtplot->setCanvasBackground(Qt::gray);//背景

	//添加曲线
	curve_Z = new QwtPlotCurve();
	curve_Z->setPen( Qt::yellow, 1 ); //曲线的颜色 宽度;

	QTime curtime;
	curtime=curtime.currentTime();

	//设置刻度
	qwtplot->setAxisScale(QwtPlot::yLeft,-2,2,1); //设置刻度范围-2到2,间隔是1
	qwtplot->setAxisScale(QwtPlot::xBottom,-5,0,1);

	//设置网格
	QwtPlotGrid *grid = new QwtPlotGrid();
	grid->enableX( true );//设置网格线
	grid->enableY( true );
	grid->setMajorPen( Qt::black, 0, Qt::DotLine );
	grid->attach(qwtplot);

	//时间
	//connect(&updateTimer,SIGNAL(timeout()),this,SLOT(updatedataSlot_Z()));
	//updateTimer.start(0);

}
//模拟数据
double mywidget::getData_Z(double time)
{
	double s = 0.5*qSin( time * M_PI * 2 ) ;
	return s;
}

void mywidget::updatedataSlot_Z()
{
	static QTime dataTime(QTime::currentTime());
	long int eltime = dataTime.elapsed();
	static int lastpointtime = 0;

	int size = (eltime - lastpointtime);


	if(size>0)
	{
		//有数据传入
		Z_data.erase(Z_data.begin(),Z_data.begin()+size);//擦除多余的数据
		for(int i=1;i<size+1;i++)
		{
			Z_data.append(getData_Z((((double)lastpointtime+i)/1000)));
		}
		lastpointtime = eltime;
	}

	curve_Z->setSamples(t_data, Z_data);
	curve_Z->attach(ui.qwtPlot_Z);

	ui.qwtPlot_Z->replot();
}


void mywidget::setupqwt_RX(QwtPlot* qwtplot)
{
	//初始化xdata,x对应长度为5的坐标,y初始全为0
	for(int i=1;i<5001;i++)
	{
		t_data.append(double(i)/1000-5);
		RX_data.append(0);
	}
	qwtplot->setTitle("The force of RX");
	qwtplot->setCanvasBackground(Qt::gray);//背景

	//添加曲线
	curve_RX = new QwtPlotCurve();
	curve_RX->setPen( Qt::yellow, 1 ); //曲线的颜色 宽度;

	QTime curtime;
	curtime=curtime.currentTime();

	//设置刻度
	qwtplot->setAxisScale(QwtPlot::yLeft,-2,2,1); //设置刻度范围-2到2,间隔是1
	qwtplot->setAxisScale(QwtPlot::xBottom,-5,0,1);

	//设置网格
	QwtPlotGrid *grid = new QwtPlotGrid();
	grid->enableX( true );//设置网格线
	grid->enableY( true );
	grid->setMajorPen( Qt::black, 0, Qt::DotLine );
	grid->attach(qwtplot);

	//时间
	//connect(&updateTimer,SIGNAL(timeout()),this,SLOT(updatedataSlot_RX()));
	//updateTimer.start(0);

}
//模拟数据
double mywidget::getData_RX(double time)
{
	double s = qSin( time * M_PI * 2 ) ;
	return s;
}

void mywidget::updatedataSlot_RX()
{
	static QTime dataTime(QTime::currentTime());
	long int eltime = dataTime.elapsed();
	static int lastpointtime = 0;

	int size = (eltime - lastpointtime);


	if(size>0)
	{
		//有数据传入
		RX_data.erase(RX_data.begin(),RX_data.begin()+size);//擦除多余的数据
		for(int i=1;i<size+1;i++)
		{
			RX_data.append(getData_RX((((double)lastpointtime+i)/1000)));
		}
		lastpointtime = eltime;
	}

	curve_RX->setSamples(t_data, RX_data);
	curve_RX->attach(ui.qwtPlot_RX);

	ui.qwtPlot_RX->replot();
}

void mywidget::setupqwt_RY(QwtPlot* qwtplot)
{
	//初始化xdata,x对应长度为5的坐标,y初始全为0
	for(int i=1;i<5001;i++)
	{
		t_data.append(double(i)/1000-5);
		RY_data.append(0);
	}
	qwtplot->setTitle("The force of RY");
	qwtplot->setCanvasBackground(Qt::gray);//背景

	//添加曲线
	curve_RY = new QwtPlotCurve();
	curve_RY->setPen( Qt::yellow, 1 ); //曲线的颜色 宽度;

	QTime curtime;
	curtime=curtime.currentTime();

	//设置刻度
	qwtplot->setAxisScale(QwtPlot::yLeft,-2,2,1); //设置刻度范围-2到2,间隔是1
	qwtplot->setAxisScale(QwtPlot::xBottom,-5,0,1);

	//设置网格
	QwtPlotGrid *grid = new QwtPlotGrid();
	grid->enableX( true );//设置网格线
	grid->enableY( true );
	grid->setMajorPen( Qt::black, 0, Qt::DotLine );
	grid->attach(qwtplot);

	//时间
	//connect(&updateTimer,SIGNAL(timeout()),this,SLOT(updatedataSlot_RY()));
	//updateTimer.start(0);

}
//模拟数据
double mywidget::getData_RY(double time)
{
	double s = qSin( time * M_PI * 2 ) ;
	return s;
}

void mywidget::updatedataSlot_RY()
{
	static QTime dataTime(QTime::currentTime());
	long int eltime = dataTime.elapsed();
	static int lastpointtime = 0;

	int size = (eltime - lastpointtime);


	if(size>0)
	{
		//有数据传入
		RY_data.erase(RY_data.begin(),RY_data.begin()+size);//擦除多余的数据
		for(int i=1;i<size+1;i++)
		{
			RY_data.append(getData_RY((((double)lastpointtime+i)/1000)));
		}
		lastpointtime = eltime;
	}

	curve_RY->setSamples(t_data, RY_data);
	curve_RY->attach(ui.qwtPlot_RY);

	ui.qwtPlot_RY->replot();
}

void mywidget::setupqwt_RZ(QwtPlot* qwtplot)
{
	//初始化xdata,x对应长度为5的坐标,y初始全为0
	for(int i=1;i<5001;i++)
	{
		t_data.append(double(i)/1000-5);
		RZ_data.append(0);
	}
	qwtplot->setTitle("The force of RZ");
	qwtplot->setCanvasBackground(Qt::gray);//背景

	//添加曲线
	curve_RZ = new QwtPlotCurve();
	curve_RZ->setPen( Qt::yellow, 1 ); //曲线的颜色 宽度;

	QTime curtime;
	curtime=curtime.currentTime();

	//设置刻度
	qwtplot->setAxisScale(QwtPlot::yLeft,-2,2,1); //设置刻度范围-2到2,间隔是1
	qwtplot->setAxisScale(QwtPlot::xBottom,-5,0,1);

	//设置网格
	QwtPlotGrid *grid = new QwtPlotGrid();
	grid->enableX( true );//设置网格线
	grid->enableY( true );
	grid->setMajorPen( Qt::black, 0, Qt::DotLine );
	grid->attach(qwtplot);

	//时间
	//connect(&updateTimer,SIGNAL(timeout()),this,SLOT(updatedataSlot_RZ()));
	//updateTimer.start(0);

}
//模拟数据
double mywidget::getData_RZ(double time)
{
	double s = qSin( time * M_PI * 2 ) ;
	return s;
}

void mywidget::updatedataSlot_RZ()
{
	static QTime dataTime(QTime::currentTime());
	long int eltime = dataTime.elapsed();
	static int lastpointtime = 0;

	int size = (eltime - lastpointtime);


	if(size>0)
	{
		//有数据传入
		RZ_data.erase(RZ_data.begin(),RZ_data.begin()+size);//擦除多余的数据
		for(int i=1;i<size+1;i++)
		{
			RZ_data.append(getData_RZ((((double)lastpointtime+i)/1000)));
		}
		lastpointtime = eltime;
	}

	curve_RZ->setSamples(t_data, RZ_data);
	curve_RZ->attach(ui.qwtPlot_RZ);

	ui.qwtPlot_RZ->replot();
}

void mywidget::start()
{
	updateTimer.start(0);
	connect(&updateTimer,SIGNAL(timeout()),this,SLOT(updatedataSlot_X()));
	connect(&updateTimer,SIGNAL(timeout()),this,SLOT(updatedataSlot_Y()));
	connect(&updateTimer,SIGNAL(timeout()),this,SLOT(updatedataSlot_Z()));
	connect(&updateTimer,SIGNAL(timeout()),this,SLOT(updatedataSlot_RX()));
	connect(&updateTimer,SIGNAL(timeout()),this,SLOT(updatedataSlot_RY()));
	connect(&updateTimer,SIGNAL(timeout()),this,SLOT(updatedataSlot_RZ()));

}
void mywidget::finish()
{
	disconnect(&updateTimer,SIGNAL(timeout()),this,SLOT(updatedataSlot_X()));
	disconnect(&updateTimer,SIGNAL(timeout()),this,SLOT(updatedataSlot_Y()));
	disconnect(&updateTimer,SIGNAL(timeout()),this,SLOT(updatedataSlot_Z()));
	disconnect(&updateTimer,SIGNAL(timeout()),this,SLOT(updatedataSlot_RX()));
	disconnect(&updateTimer,SIGNAL(timeout()),this,SLOT(updatedataSlot_RY()));
	disconnect(&updateTimer,SIGNAL(timeout()),this,SLOT(updatedataSlot_RZ()));

}
ui_mywidget.h如下:
/********************************************************************************
** Form generated from reading UI file 'mywidget.ui'
**
** Created by: Qt User Interface Compiler version 5.3.1
**
** WARNING! All changes made in this file will be lost when recompiling UI file!
********************************************************************************/

#ifndef UI_MYWIDGET_H
#define UI_MYWIDGET_H

#include <QtCore/QVariant>
#include <QtWidgets/QAction>
#include <QtWidgets/QApplication>
#include <QtWidgets/QButtonGroup>
#include <QtWidgets/QHeaderView>
#include <QtWidgets/QPushButton>
#include <QtWidgets/QWidget>
#include "qwt_plot.h"

QT_BEGIN_NAMESPACE

class Ui_mywidgetClass
{
public:
    QwtPlot *qwtPlot_X;
    QwtPlot *qwtPlot_RX;
    QwtPlot *qwtPlot_RY;
    QwtPlot *qwtPlot_Y;
    QwtPlot *qwtPlot_Z;
    QwtPlot *qwtPlot_RZ;
    QPushButton *pushButton_star;
    QPushButton *pushButton_finish;

    void setupUi(QWidget *mywidgetClass)
    {
        if (mywidgetClass->objectName().isEmpty())
            mywidgetClass->setObjectName(QStringLiteral("mywidgetClass"));
        mywidgetClass->resize(1514, 929);
        qwtPlot_X = new QwtPlot(mywidgetClass);
        qwtPlot_X->setObjectName(QStringLiteral("qwtPlot_X"));
        qwtPlot_X->setGeometry(QRect(30, 40, 631, 221));
        qwtPlot_RX = new QwtPlot(mywidgetClass);
        qwtPlot_RX->setObjectName(QStringLiteral("qwtPlot_RX"));
        qwtPlot_RX->setGeometry(QRect(740, 40, 631, 221));
        qwtPlot_RY = new QwtPlot(mywidgetClass);
        qwtPlot_RY->setObjectName(QStringLiteral("qwtPlot_RY"));
        qwtPlot_RY->setGeometry(QRect(740, 320, 631, 221));
        qwtPlot_Y = new QwtPlot(mywidgetClass);
        qwtPlot_Y->setObjectName(QStringLiteral("qwtPlot_Y"));
        qwtPlot_Y->setGeometry(QRect(30, 320, 631, 221));
        qwtPlot_Z = new QwtPlot(mywidgetClass);
        qwtPlot_Z->setObjectName(QStringLiteral("qwtPlot_Z"));
        qwtPlot_Z->setGeometry(QRect(30, 600, 631, 221));
        qwtPlot_RZ = new QwtPlot(mywidgetClass);
        qwtPlot_RZ->setObjectName(QStringLiteral("qwtPlot_RZ"));
        qwtPlot_RZ->setGeometry(QRect(740, 600, 631, 221));
        pushButton_star = new QPushButton(mywidgetClass);
        pushButton_star->setObjectName(QStringLiteral("pushButton_star"));
        pushButton_star->setGeometry(QRect(310, 870, 75, 23));
        pushButton_finish = new QPushButton(mywidgetClass);
        pushButton_finish->setObjectName(QStringLiteral("pushButton_finish"));
        pushButton_finish->setGeometry(QRect(1040, 870, 75, 23));

        retranslateUi(mywidgetClass);
        QObject::connect(pushButton_star, SIGNAL(clicked()), mywidgetClass, SLOT(start()));
        QObject::connect(pushButton_finish, SIGNAL(clicked()), mywidgetClass, SLOT(finish()));

        QMetaObject::connectSlotsByName(mywidgetClass);
    } // setupUi

    void retranslateUi(QWidget *mywidgetClass)
    {
        mywidgetClass->setWindowTitle(QApplication::translate("mywidgetClass", "mywidget", 0));
        pushButton_star->setText(QApplication::translate("mywidgetClass", "\345\274\200\345\247\213", 0));
        pushButton_finish->setText(QApplication::translate("mywidgetClass", "\347\273\223\346\235\237", 0));
    } // retranslateUi

};

namespace Ui {
    class mywidgetClass: public Ui_mywidgetClass {};
} // namespace Ui

QT_END_NAMESPACE

#endif // UI_MYWIDGET_H
moc_mywidget.cpp如下:
/****************************************************************************
** Meta object code from reading C++ file 'mywidget.h'
**
** Created by: The Qt Meta Object Compiler version 67 (Qt 5.3.1)
**
** WARNING! All changes made in this file will be lost!
*****************************************************************************/

#include "../../mywidget.h"
#include <QtCore/qbytearray.h>
#include <QtCore/qmetatype.h>
#if !defined(Q_MOC_OUTPUT_REVISION)
#error "The header file 'mywidget.h' doesn't include <QObject>."
#elif Q_MOC_OUTPUT_REVISION != 67
#error "This file was generated using the moc from 5.3.1. It"
#error "cannot be used with the include files from this version of Qt."
#error "(The moc has changed too much.)"
#endif

QT_BEGIN_MOC_NAMESPACE
struct qt_meta_stringdata_mywidget_t {
    QByteArrayData data[10];
    char stringdata[128];
};
#define QT_MOC_LITERAL(idx, ofs, len) \
    Q_STATIC_BYTE_ARRAY_DATA_HEADER_INITIALIZER_WITH_OFFSET(len, \
    qptrdiff(offsetof(qt_meta_stringdata_mywidget_t, stringdata) + ofs \
        - idx * sizeof(QByteArrayData)) \
    )
static const qt_meta_stringdata_mywidget_t qt_meta_stringdata_mywidget = {
    {
QT_MOC_LITERAL(0, 0, 8),
QT_MOC_LITERAL(1, 9, 16),
QT_MOC_LITERAL(2, 26, 0),
QT_MOC_LITERAL(3, 27, 16),
QT_MOC_LITERAL(4, 44, 16),
QT_MOC_LITERAL(5, 61, 17),
QT_MOC_LITERAL(6, 79, 17),
QT_MOC_LITERAL(7, 97, 17),
QT_MOC_LITERAL(8, 115, 5),
QT_MOC_LITERAL(9, 121, 6)
    },
    "mywidget\0updatedataSlot_X\0\0updatedataSlot_Y\0"
    "updatedataSlot_Z\0updatedataSlot_RX\0"
    "updatedataSlot_RY\0updatedataSlot_RZ\0"
    "start\0finish"
};
#undef QT_MOC_LITERAL

static const uint qt_meta_data_mywidget[] = {

 // content:
       7,       // revision
       0,       // classname
       0,    0, // classinfo
       8,   14, // methods
       0,    0, // properties
       0,    0, // enums/sets
       0,    0, // constructors
       0,       // flags
       0,       // signalCount

 // slots: name, argc, parameters, tag, flags
       1,    0,   54,    2, 0x0a /* Public */,
       3,    0,   55,    2, 0x0a /* Public */,
       4,    0,   56,    2, 0x0a /* Public */,
       5,    0,   57,    2, 0x0a /* Public */,
       6,    0,   58,    2, 0x0a /* Public */,
       7,    0,   59,    2, 0x0a /* Public */,
       8,    0,   60,    2, 0x0a /* Public */,
       9,    0,   61,    2, 0x0a /* Public */,

 // slots: parameters
    QMetaType::Void,
    QMetaType::Void,
    QMetaType::Void,
    QMetaType::Void,
    QMetaType::Void,
    QMetaType::Void,
    QMetaType::Void,
    QMetaType::Void,

       0        // eod
};

void mywidget::qt_static_metacall(QObject *_o, QMetaObject::Call _c, int _id, void **_a)
{
    if (_c == QMetaObject::InvokeMetaMethod) {
        mywidget *_t = static_cast<mywidget *>(_o);
        switch (_id) {
        case 0: _t->updatedataSlot_X(); break;
        case 1: _t->updatedataSlot_Y(); break;
        case 2: _t->updatedataSlot_Z(); break;
        case 3: _t->updatedataSlot_RX(); break;
        case 4: _t->updatedataSlot_RY(); break;
        case 5: _t->updatedataSlot_RZ(); break;
        case 6: _t->start(); break;
        case 7: _t->finish(); break;
        default: ;
        }
    }
    Q_UNUSED(_a);
}

const QMetaObject mywidget::staticMetaObject = {
    { &QWidget::staticMetaObject, qt_meta_stringdata_mywidget.data,
      qt_meta_data_mywidget,  qt_static_metacall, 0, 0}
};


const QMetaObject *mywidget::metaObject() const
{
    return QObject::d_ptr->metaObject ? QObject::d_ptr->dynamicMetaObject() : &staticMetaObject;
}

void *mywidget::qt_metacast(const char *_clname)
{
    if (!_clname) return 0;
    if (!strcmp(_clname, qt_meta_stringdata_mywidget.stringdata))
        return static_cast<void*>(const_cast< mywidget*>(this));
    return QWidget::qt_metacast(_clname);
}

int mywidget::qt_metacall(QMetaObject::Call _c, int _id, void **_a)
{
    _id = QWidget::qt_metacall(_c, _id, _a);
    if (_id < 0)
        return _id;
    if (_c == QMetaObject::InvokeMetaMethod) {
        if (_id < 8)
            qt_static_metacall(this, _c, _id, _a);
        _id -= 8;
    } else if (_c == QMetaObject::RegisterMethodArgumentMetaType) {
        if (_id < 8)
            *reinterpret_cast<int*>(_a[0]) = -1;
        _id -= 8;
    }
    return _id;
}
QT_END_MOC_NAMESPACE
二. 讲相关文件导入ubuntu的项目中,传感器信号传递如下:


相关链接:
qwt绘制实时曲线:https://blog.csdn.net/hiccuphiccup/article/details/52879573
qwt 配置 http://blog.sina.com.cn/s/blog_a6fb6cc90101gks5.html