系列文章:
- 文章1:打造自己的树莓派监控系统1–CPU监控-matplotlib显示数据
- 文章2:打造自己的树莓派监控系统2–内存监控-matplotlib显示数据
- 文章3:打造自己的树莓派监控系统3–canvas.js绘制数据
- GitHub仓库:树莓派系统监控–CPU温度监控和内存使用监控
介绍
前面2篇文章都是使用matplotlib画图的,但当数据量较多时matplotlib的显示和交互性不让我满意,所以我使用canvas.js绘图。
canvasjs介绍:JavaScript Charts & Graphs with 10x better performance and a simple API. Integrates easily with popular JS Frameworks like AngularJS, etc. Library comes with 30 different types of charts including line, column, bar, area, spline, pie, doughnut, stacked charts, etc. It supports various interactive features like tooltips, zooming, panning, animation, events, drilldown, exporting and can easily be integrated with various server side technologies like PHP, Ruby, Python, ASP.Net, Node.JS, Java, etc. To top it all off, it can easily render thousands of data-points without any performance lag.
使用canvas.js
flask代码:
@app.route('/', methods=['GET'])
def main():
    temperature = get_temperature()
    mem, MemTotal = get_mem()
    return render_template('index.html', temperature=temperature, mem=mem, MemTotal=MemTotal)
HTML核心代码:
    <script type="text/javascript">
    function cpu() {
        var chart = new CanvasJS.Chart("cpuchart", {
            theme: "light2", // "light1", "light2", "dark1", "dark2"
            animationEnabled: true,
            zoomEnabled: true,
            title: {
                text: "CPU温度图"
            },
            axisX: {
                title: "时间",
                gridThickness: 2
            },
            axisY: {
                title: "CPU温度"
            },
            data: [{
                type: "area",
                xValueType: "dateTime",
                dataPoints: [ //array
                    { % for i in temperature % }
                    { { "{x:" } } { { i[1] } } { { ",y:" } } { { i[0] / 1000 } } { { "}," } }
                    { % endfor % }

                ]
            }]
        });

        chart.render();
    }

    function mem() {
        var chart = new CanvasJS.Chart("memchart", {
            theme: "light2", // "light1", "light2", "dark1", "dark2"
            animationEnabled: true,
            zoomEnabled: true,
            title: {
                text: "内存使用情况图"
            },
            axisX: {
                title: "时间",
                gridThickness: 2
            },
            axisY: {
                maximum: { { MemTotal } },
                title: "内存使用"
            },
            data: [{
                type: "area",
                xValueType: "dateTime",
                dataPoints: [ //array
                    { % for i in mem % }
                    { { "{x:" } } { { i[1] } } { { ",y:" } } { { i[0] } } { { "}," } }
                    { % endfor % }

                ]
            }]
        });

        chart.render();
    }
    window.onload = function() {
        cpu();
        mem();
    }
    </script>
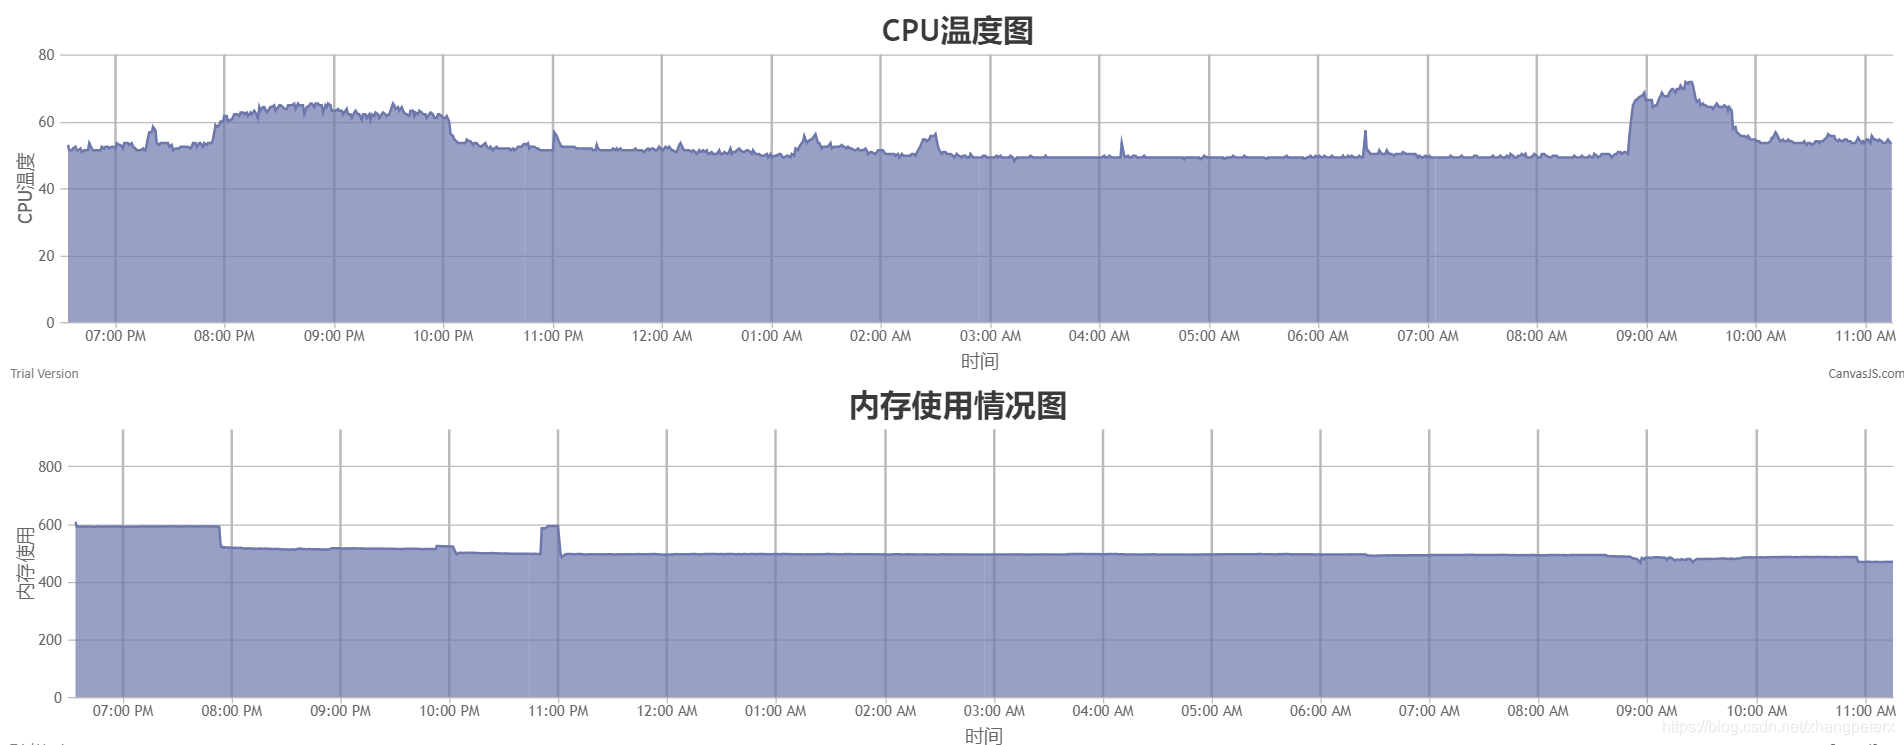
效果图如下: