本实例是关于百度地图插件展示统计数据的,echarts中要处理后台传过来的json类型的数据:
- 后台的封装json代码片段
代码块
java代码:
Map<String, Object> map = new HashMap<String, Object>();
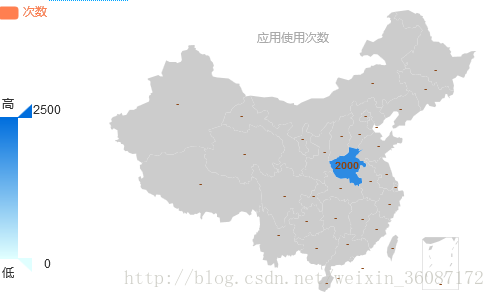
map.put("name","河南");
map.put("value",2000);
List list=new ArrayList();
list.add(map);
/*map = new HashMap<String, Object>();
map.put("name","河北");
map.put("value",2400);
list.add(map);*/
request.setAttribute("mapDataJson", JSONArray.fromObject(list));
- jsp端的接收
代码块
jsp代码:
<script type="text/javascript" src='${root}/common/js/echarts.js'></script>


<div id="mainMap" style="height:300px;width:600px;"></div>
<script type="text/javascript">
    var mapDataJson='${mapDataJson}';
    var json=JSON.parse(mapDataJson);

    // 路径配置
    require.config({
        paths: {
            echarts: 'http://echarts.baidu.com/build/dist'
        }
    });
    // 使用
    require(
            [
                'echarts',
                'echarts/chart/map' // 使用柱状图就加载bar模块,按需加载
            ],
            function (ec) {
                // 基于准备好的dom,初始化echarts图表
                var myChart_map = ec.init(document.getElementById('mainMap'));

                var itemStyle = {
                    normal:{label:{
                        show:true,
                        formatter:'{b}',
                        textStyle: {fontSize: 10,fontWeight : 'bold'}
                    }},
                    emphasis:{label:{show:true}}
                };

                var option_map = {
                    title : {
                        text: '',
                        subtext: '应用使用次数',
                        x:'center'
                    },
                    tooltip : {
                        trigger: 'item'
                    },
                    legend: {
                        orient: 'vertical',
                        x:'left',
                        data:['次数']
                    },
                    dataRange: {
                        min: 0,
                        max: 2500,
                        x: 'left',
                        y: 'bottom',
                        text:['高','低'],           // 文本,默认为数值文本
                        calculable : true
                    },

                    series : [
                        {
                            name: '总数',
                            type: 'map',
                            mapType: 'china',
                            roam: false,
//                            itemStyle:{
//                                normal:{label:{show:true}},
//                                emphasis:{label:{show:true}}
//                            },
                            itemStyle: itemStyle,
                            data:getData()
                        }

                    ]
                };

                //option_map.series[0].data=json;

                // 为echarts对象加载数据
                myChart_map.setOption(option_map);
            }
    );
    function getData(){
        return json;
        }
</script>
- 客户端浏览