k-means算法的原理作为无监督算法,看起来和knn算法挺像的,但是knn作为有监督算法,还是有一定区别至于k-means算法原理及其伪代码就不说了。在实现k-means算法中,还是有些地方需要注意的,废话少说,还是来先看看代码。
import numpy
import matplotlib.pyplot as plt
def readdata(filename):#读入数据
zhuancun=[]
ff=open(filename)
for i in ff.readlines():
temp1=i.split('\n')[0].split('\t')
#关于数据转换,这两种写法都是可以的
#写法一:
temp=list(map(float,temp1))
#写法二:
#zhuancun.append(temp1)
#zhuancun=[list(map(float,line)) for line in zhuancun]
zhuancun.append(temp)
return numpy.array(zhuancun)
def creat_cluter(dataset,dataset_lie_shu,tezhengshu):
temp_cluter=numpy.array(numpy.zeros([tezhengshu,dataset_lie_shu]))
for i in range(dataset_lie_shu):
min_lie=numpy.min(dataset[:,i])
max_lie=numpy.max(dataset[:,i])
kuadu_lie=max_lie-min_lie
ran_lie=kuadu_lie*(numpy.random.random())+min_lie
temp_cluter[:,i]=ran_lie
return numpy.array(temp_cluter)
def jisuan_distance(date1,date2):
return numpy.sqrt(sum(pow(date1-date2,2)))
def kmeans(dataset,tezhengshu):
dataset_lie_shu=numpy.shape(dataset)[1]
dataset_hang_shu=numpy.shape(dataset)[0]
#
#这里非常关键,一定要将其设为1的矩阵,否则造成一次就退出了
#
#
tongji_juzhen=numpy.array(numpy.ones([dataset_hang_shu,2]))
#ll=numpy.ones([dataset_hang_shu, 1])
#print(type(ll))
#print_date(dataset,numpy.array(numpy.ones([dataset_hang_shu,1])).flatten())
creat_random_juzhen=creat_cluter(dataset,dataset_lie_shu,4)
clu_change=True
lun_index=1
while clu_change:
#这句目的是一次迭代之后则改变标志位,如果中途没有哪个位分类错误了,则会导致整个迭代过程退出
clu_change=False
for i in range(dataset_hang_shu):
juli_juzhen=[(jisuan_distance(creat_random_juzhen[j,:],dataset[i,:])) for j in range(4)]
zhi_min_juli_juzhen=min(juli_juzhen)
index_min_juli_juzhen=juli_juzhen.index(zhi_min_juli_juzhen)
#如果这个点分类还是会改变说明还要继续分类,即继续迭代一次就是为了为了这个点,即采用新的簇之后,这是这个函数非常关键的地方
if tongji_juzhen[i,0] != index_min_juli_juzhen:
clu_change=True
#将这个点的分类结果及距离他所属簇距离写入统计矩阵
tongji_juzhen[i,:]=index_min_juli_juzhen,zhi_min_juli_juzhen
for i in range(4):
belong_juzhen=numpy.nonzero(tongji_juzhen[:,0] == i)[0]
#print(belong_juzhen)
belong_dataset=dataset[belong_juzhen]
if len(belong_juzhen) != 0:
creat_random_juzhen[i,]=numpy.mean(belong_dataset,axis=0)
print("第%d轮第%d个簇点改变:"%(lun_index,i))
print(creat_random_juzhen)
lun_index+=1
return creat_random_juzhen,tongji_juzhen
def print_date(dateset,lables):
color=['b','c','g','k','m','r','w','y']
kong_temp={}
for i in lables:
if i not in kong_temp.keys():
kong_temp[i]=0
kong_temp[i]+=1
kong_temp[5]=90
print(kong_temp)
print("*******")
print(list(kong_temp.keys()))
for index,ky in enumerate(list(kong_temp.keys())):
kong_temp[ky]=color[index]
print(kong_temp)
#print(kong_temp)
fig=plt.figure()
ax=fig.add_subplot(111)
plt.title('The third graph')
plt.xlabel('X')
plt.ylabel('Y')
ax.scatter(dataset[:,0],dataset[:,1],s=10*lables,c='g')
plt.show()
def print_data_test(dataset,tongji_juzhen,cluter_juzhen):
color=['b','c','g','k','m','r','w','y']
fig = plt.figure()
ax = fig.add_subplot(111)
plt.title('The third graph')
plt.xlabel('X')
plt.ylabel('Y')
print(tongji_juzhen[:,0])
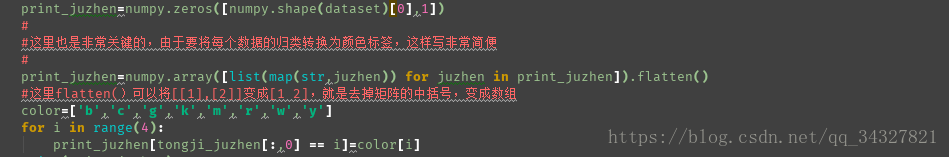
print_juzhen=numpy.zeros([numpy.shape(dataset)[0],1])
#
#这里也是非常关键的,由于要将每个数据的归类转换为颜色标签,这样写非常简便
#
print_juzhen=numpy.array([list(map(str,juzhen)) for juzhen in print_juzhen]).flatten()
#
for i in range(4):
print_juzhen[tongji_juzhen[:,0] == i]=color[i]
print(print_juzhen)
print(type(tongji_juzhen[:,0]))
ax.scatter(dataset[:, 0], dataset[:, 1],c=print_juzhen)
ax.scatter(cluter_juzhen[:,0],cluter_juzhen[:,1],s=120,c='r',marker='<')
plt.show()
dataset=readdata('testSet-kmeans.txt')
cluter_juzhen,tongji_juzhen=kmeans(dataset,4)
print_data_test(dataset,tongji_juzhen,cluter_juzhen)运行结果如图:
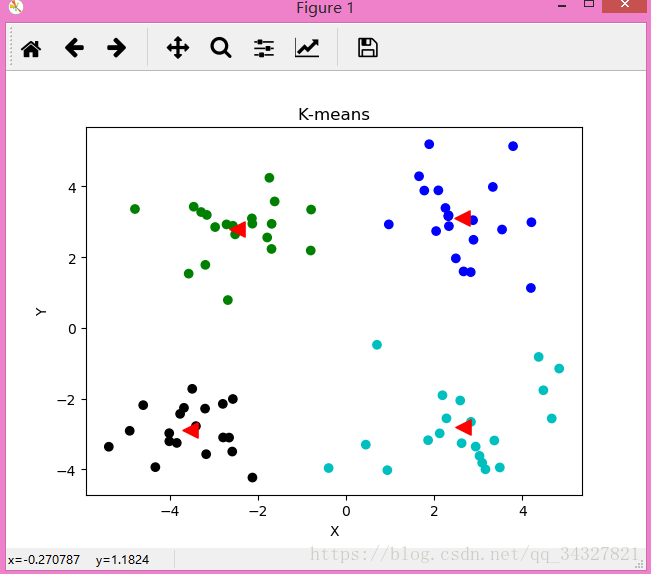
但是这里还是有几个点需要注意的。
第一点:第一次产生的统计样本集特征矩阵必须是全是1,至少这个矩阵记录每个样本属于哪个类必须是1,这样能够避免错误,否则会产生一些后果。比如迭代一次之后就不会再去迭代了。
第二点:这里非常关键的一点就是继续迭代的条件,如果现在迭代错误,才会继续迭代下去。
第三点:对于将已经分类好的矩阵tongji_juzhen[:,0],取出第0列之后,若要将其第0列的值与颜色标签对应起来,怎么写更简化呢?
期间还发生了一个错误:
发生 原因是在选出其他分类所对应的数据集时,由于会产生空的数组,传入mean()函数中。
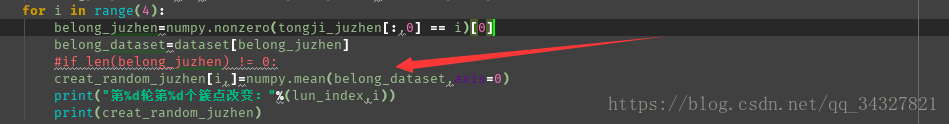
解决方法就是先判断,不为空才传入!