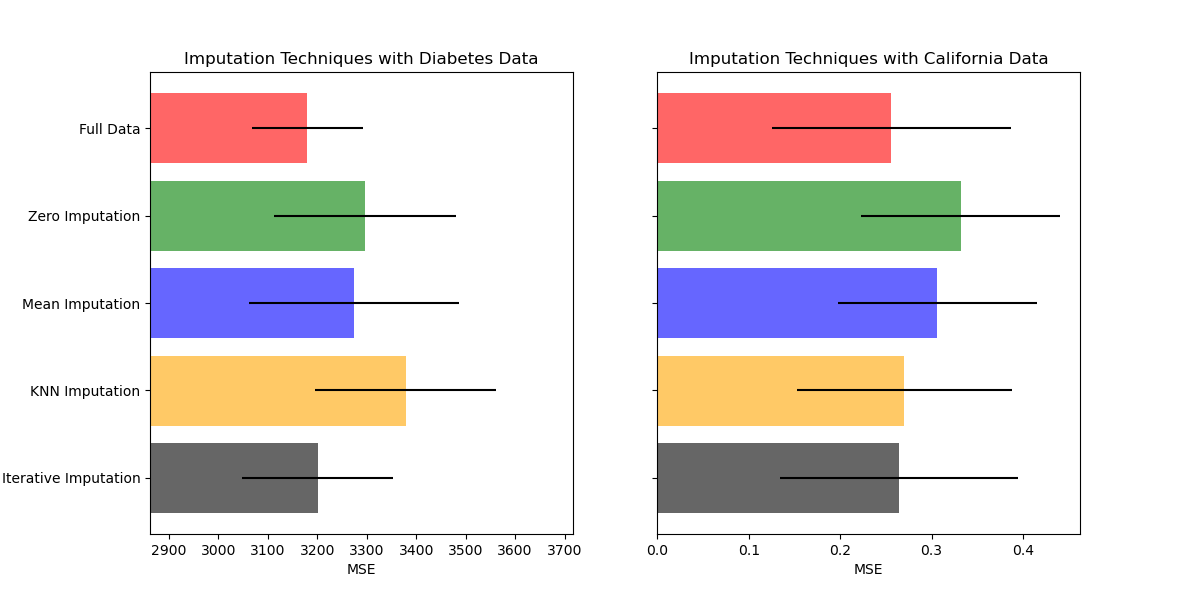
在构建估算器之前输入缺失值
此示例显示,丢弃缺失值可以提供比丢弃包含任何缺失值的样本更好的结果。 输入并不总能改善预测,因此请通过交叉验证进行检查。 有时丢弃行或使用标记值更有效。
使用基本sklearn.impute.SimpleImputer可以将均值,中值或最常值替换为缺失值。 对于具有高幅度变量的数据,中值是更稳健的估计,其可以支配结果(否则称为“长尾”)。
除了使用imputing方法之外,我们还可以使用sklearn.impute.MissingIndicator来保存缺少信息的指示,这可能会带有一些信息。
import numpy as np
import matplotlib.pyplot as plt

from sklearn.datasets import load_diabetes
from sklearn.datasets import load_boston
from sklearn.ensemble import RandomForestRegressor
from sklearn.pipeline import make_pipeline, make_union
from sklearn.impute import SimpleImputer, MissingIndicator
from sklearn.model_selection import cross_val_score

rng = np.random.RandomState(0)


def get_results(dataset):
    X_full, y_full = dataset.data, dataset.target
    n_samples = X_full.shape[0]
    n_features = X_full.shape[1]

    # Estimate the score on the entire dataset, with no missing values
    estimator = RandomForestRegressor(random_state=0, n_estimators=100)
    full_scores = cross_val_score(estimator, X_full, y_full,
                                  scoring='neg_mean_squared_error', cv=5)

    # Add missing values in 75% of the lines
    missing_rate = 0.75
    n_missing_samples = int(np.floor(n_samples * missing_rate))
    missing_samples = np.hstack((np.zeros(n_samples - n_missing_samples,
                                          dtype=np.bool),
                                 np.ones(n_missing_samples,
                                         dtype=np.bool)))
    rng.shuffle(missing_samples)
    missing_features = rng.randint(0, n_features, n_missing_samples)

    # Estimate the score after replacing missing values by 0
    X_missing = X_full.copy()
    X_missing[np.where(missing_samples)[0], missing_features] = 0
    y_missing = y_full.copy()
    estimator = RandomForestRegressor(random_state=0, n_estimators=100)
    zero_impute_scores = cross_val_score(estimator, X_missing, y_missing,
                                         scoring='neg_mean_squared_error',
                                         cv=5)

    # Estimate the score after imputation (mean strategy) of the missing values
    X_missing = X_full.copy()
    X_missing[np.where(missing_samples)[0], missing_features] = 0
    y_missing = y_full.copy()
    estimator = make_pipeline(
        make_union(SimpleImputer(missing_values=0, strategy="mean"),
                   MissingIndicator(missing_values=0)),
        RandomForestRegressor(random_state=0, n_estimators=100))
    mean_impute_scores = cross_val_score(estimator, X_missing, y_missing,
                                         scoring='neg_mean_squared_error',
                                         cv=5)


    return ((full_scores.mean(), full_scores.std()),
            (zero_impute_scores.mean(), zero_impute_scores.std()),
            (mean_impute_scores.mean(), mean_impute_scores.std()))


results_diabetes = np.array(get_results(load_diabetes()))
mses_diabetes = results_diabetes[:, 0] * -1
stds_diabetes = results_diabetes[:, 1]

results_boston = np.array(get_results(load_boston()))
mses_boston = results_boston[:, 0] * -1
stds_boston = results_boston[:, 1]

n_bars = len(mses_diabetes)
xval = np.arange(n_bars)

x_labels = ['Full data',
            'Zero imputation',
            'Mean Imputation']
colors = ['r', 'g', 'b', 'orange']

# plot diabetes results
plt.figure(figsize=(12, 6))
ax1 = plt.subplot(121)
for j in xval:
    ax1.barh(j, mses_diabetes[j], xerr=stds_diabetes[j],
             color=colors[j], alpha=0.6, align='center')

ax1.set_title('Imputation Techniques with Diabetes Data')
ax1.set_xlim(left=np.min(mses_diabetes) * 0.9,
             right=np.max(mses_diabetes) * 1.1)
ax1.set_yticks(xval)
ax1.set_xlabel('MSE')
ax1.invert_yaxis()
ax1.set_yticklabels(x_labels)

# plot boston results
ax2 = plt.subplot(122)
for j in xval:
    ax2.barh(j, mses_boston[j], xerr=stds_boston[j],
             color=colors[j], alpha=0.6, align='center')

ax2.set_title('Imputation Techniques with Boston Data')
ax2.set_yticks(xval)
ax2.set_xlabel('MSE')
ax2.invert_yaxis()
ax2.set_yticklabels([''] * n_bars)

plt.show()
sklearn.impute.SimpleImputer
>>> import numpy as np
>>> from sklearn.impute import SimpleImputer
>>> imp_mean = SimpleImputer(missing_values=np.nan, strategy='mean')
>>> imp_mean.fit([[7, 2, 3], [4, np.nan, 6], [10, 5, 9]])
...
SimpleImputer(copy=True, fill_value=None, missing_values=nan,
       strategy='mean', verbose=0)
>>> X = [[np.nan, 2, 3], [4, np.nan, 6], [10, np.nan, 9]]
>>> print(imp_mean.transform(X))
...
[[ 7.   2.   3. ]
 [ 4.   3.5  6. ]
 [10.   3.5  9. ]]
Methods
fit(X[, y]) |
Fit the imputer on X. |
fit_transform(X[, y]) |
Fit to data, then transform it. |
get_params([deep]) |
Get parameters for this estimator. |
set_params(**params) |
Set the parameters of this estimator. |
transform(X) |
Impute all missing values in X. |
sklearn.impute.MissingIndicator
>>> import numpy as np
>>> from sklearn.impute import MissingIndicator
>>> X1 = np.array([[np.nan, 1, 3],
...                [4, 0, np.nan],
...                [8, 1, 0]])
>>> X2 = np.array([[5, 1, np.nan],
...                [np.nan, 2, 3],
...                [2, 4, 0]])
>>> indicator = MissingIndicator()
>>> indicator.fit(X1)
MissingIndicator(error_on_new=True, features='missing-only',
         missing_values=nan, sparse='auto')
>>> X2_tr = indicator.transform(X2)
>>> X2_tr
array([[False,  True],
       [ True, False],
       [False, False]])
Methods
fit(X[, y]) |
Fit the transformer on X. |
fit_transform(X[, y]) |
Generate missing values indicator for X. |
get_params([deep]) |
Get parameters for this estimator. |
set_params(**params) |
Set the parameters of this estimator. |
transform(X) |
Generate missing values indicator for X. |