import numpy as np
import matplotlib
matplotlib.use(“TkAgg”)
import matplotlib.pyplot as plt
from mpl_toolkits.mplot3d import Axes3D
import matplotlib.gridspec as gridspec
plt.figure()
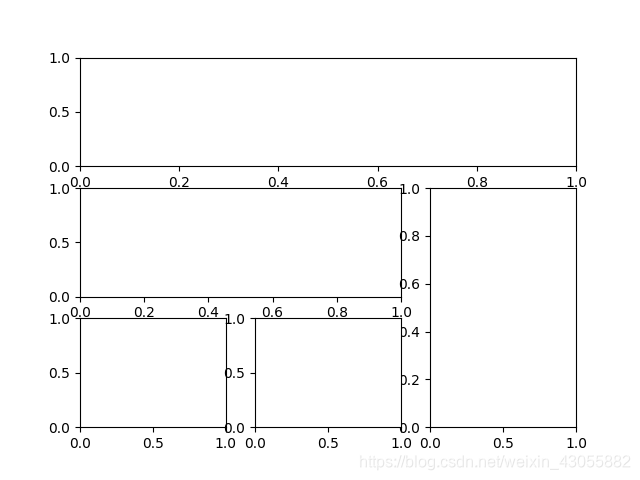
gs=gridspec.GridSpec(3,3)#分为3行3列
ax1=plt.subplot(gs[0,:])
ax1=plt.subplot(gs[1,:2])
ax1=plt.subplot(gs[1:,2])
ax1=plt.subplot(gs[-1,0])
ax1=plt.subplot(gs[-1,-2])
plt.show()