版权声明:原创不易,转载请注明出处~ https://blog.csdn.net/qq_34266804/article/details/86645932
首先,数据库的数据表中只有一条数据,如下图

Echarts显示的情况肯定不是一条线,而是一个点(因为只有两个点以及以上才可以组成线的),如下图:


思路:
首先肯定是先判断我这个数据是不是一条,若不是一条数据,也就没必要去加了,(他本来就不是一个孤立的点)
是一条数据时,再想办法加入一条数据(数量为0的)。
找到X轴日期的前一天(前一天的发生的知道,后一天的告警数量不可知,不能置为后一天的日期,更不能置为一个固定的日期,万一他存在的那一条数据刚好是你所置为0的那个日期岂不是很尴尬呐。。),存入X轴列表中,然后将他的告警数量置为0,将(前一天日期,数量0)这两个数据存入。
先看看最后显示出来的图形吧,然后再分享解决办法:
数据库就是上面的一条数据,没有更改。2019-12-25。

首先说明一下,我的数据库中取出来的数据日期,是String类型的,
-
先将String类型的数据转换为Date类型的
-
用Date类型的方法求出该日期的前一天
-
将前一天的Date类型的日期转化为String类型的
-
将数据存入x轴的数据列表中

是不是还差个什么啊,对喽,还有将数量0存入呢。

好了,大功告成。
自己起初想的是:他不是String类型的数据嘛,我把它最后一个数字切割后,给他再补一个0过去,
例如2019-1-25 将25的5减去变为2了,再给他加上0,就是20,那就变成2019-1-20了。。
但是转念一想,万一他是2019-1-20呢,我将20的0减去,再加个0不就跟没变一样的嘛,还给数据置为0了,不行不行
万一他是2019-1-1,我变一下不就变成2019-1-0,不合情理。
最后想到,Date日期的求前一天的方法。这个不错。事实证明了,也是正确的。
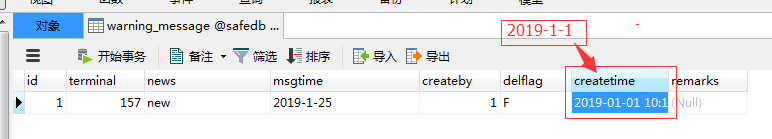
现在我将数据库中的数据表中的数据置为2019-1-1看看是怎么样显示的:
数据如下图:
折线图如下图显示:

附上折线图的jsp代码和Action代码:
jsp:
<%@ page contentType="text/html;charset=UTF-8" language="java"%>
<%@ include file="/WEB-INF/views/common/common.jsp"%>
<!DOCTYPE html PUBLIC "-//W3C//DTD XHTML 1.0 Transitional//EN" "http://www.w3.org/TR/xhtml1/DTD/xhtml1-transitional.dtd">
<html xmlns="http://www.w3.org/1999/xhtml">
<head>
<meta http-equiv="Content-Type" content="text/html; charset=utf-8" />
<title>首页</title>
<%@ include file="/WEB-INF/views/common/refOutResource.jsp"%>
<script type="text/javascript"
src="${basePath}libs/js/echarts/echarts.js"></script>
<script type="text/javascript"
src="${basePath}libs/js/echarts/echarts.min.js"></script>
<!-- 日期控件start -->
<script type="text/javascript"
src="${basePath}libs/js/form/datePicker/WdatePicker.js"></script>
<!-- 日期控件end -->
</head>
<body style="height:100%;width:100%">
<div
style="width:100%;height:100%;overflow-x:hidden;margin:auto auto auto auto;">
<!-- <table width="100%"> -->
<%-- <tr>
<td style="padding:10px 0px 0px 20px;">统计时间: <input type="text"
name="startDate" id="startDate" value="${startDate}" class="date" />-<input
type="text" id="endDate" value="${endDate}" name="endDate"
class="date" /> <input type="button"
onclick="searchHandler()" value="查询" /> <input id="Week"
name="Week" type="button" value="本周" onclick="searchHandlerWeek()" />
<input id="Month" name="Month" type="button" value="本月"
onclick="searchHandlerMonth()" /> <input id="Quarter"
name="Quarter" type="button" value="本季度"
onclick="searchHandlerQuarter()" />
</td>
</tr> --%>
<!-- </table> -->
<div style="width:100%;">
<div id='pie' style="width: 50%; height: 300px; float:left;"></div>
<div style="width: 50%; height: 300px; float:right;">
<div class="box1" whiteBg="true" style="height:25%">
<table class="tableStyle" formMode="view">
<tr>
<td style="font-size:20px">机器总数:</td>
<td colspan=5 style="font-size:20px">${terminalTotal}</td>
</tr>
<tr>
<td width="5%" style="font-size:20px">在线:</td>
<td width="20%" style="font-size:20px">${onlineSum}</td>
<td width="15%" style="font-size:20px">离线:</td>
<td width="15%" style="font-size:20px">${offlineSum}</td>
<td width="15%" style="font-size:20px">告警:</td>
<td width="15%" style="font-size:20px">${alarmSum}</td>
</tr>
<tr>
<td width="25%" style="font-size:20px">最后安全核查时间:</td>
<td colspan=5 style="font-size:20px">${lastSafeTime}</td>
</tr>
<tr>
<td style="font-size:20px">检查台数:</td>
<td colspan=5 style="font-size:20px">${checkNum}</td>
</tr>
<tr>
<td style="font-size:20px">接收台数:</td>
<td style="font-size:20px">${receiveNum}</td>
<td style="font-size:20px">反馈台数:</td>
<td colspan=3 style="font-size:20px">${backNum}</td>
</tr>
</table>
</div>
</div>
<div>
<div id='lines' style="width: 50%; height: 300px; float:left "></div>
<div id='columnar' style="width: 50%; height: 300px; float:right "></div>
</div>
<script type="text/javascript">
/* function customHeightSet(contentHeight){
$("#openContent").height(contentHeight);
} */
//本周start
/* var week;
function searchHandlerWeek() {
week = $("#Week").val(); // 根据ID 获取值
window.location.href = "${basePath}terwarning/terminal/terminalTotal.view?";
}
//本周end
//本月start
var month;
function searchHandlerMonth() {
week = $("#Month").val(); // 根据ID 获取值
window.location.href = "${basePath}terwarning/terminal/terminalTotal.view?";
}
//本月end
//本季度start
var quarter;
function searchHandlerQuarter() {
week = $("#Quarter").val(); // 根据ID 获取值
window.location.href = "${basePath}terwarning/terminal/terminalTotal.view?";
}
//本季度end
var startDate;
var endDate;
function searchHandler() {
startDate = $("#startDate").val(); // 根据ID 获取值
endDate = $("#endDate").val(); // 根据ID 获取值
window.location.href = "${basePath}terwarning/terminal/terminalTotal.view?startDate="
+ startDate + "&endDate=" + endDate;
} */
//饼状图start
var pieCharts = echarts.init(document.getElementById('pie'));
option = {
//backgroundColor : '#2c343c',
title : {
text : '注册终端情况',
//x:'center'
},
tooltip : {
trigger : 'item',
formatter : "{a} <br/>{b} : {c} ({d}%)"
},
toolbox : { //工具栏(图片下载)
feature : {
saveAsImage : {}
},
right : '5%',
},
legend : {
orient : 'vertical',
left : 'center',
data : [ '在线', '告警', '离线' ]
},
color : [ '#8fc31f', '#00ccff', '#f35833', ],
series : [ {
name : '状态',
type : 'pie',
radius : '55%',
data : [ {
value : ${onlineSum},
//value : ${taskOnlineData},
//value : 300,
name : '在线'
}, {
value : ${offlineSum},
//value : ${taskOfflineData},
//value : 400,
name : '离线'
}, {
value : ${alarmSum},
//value : ${taskAlarmData},
//value : 300,
name : '告警'
}, ]
} ]
};
pieCharts.setOption(option);
//饼状图end
//柱状图start
var dom = document.getElementById("columnar");
var myChart = echarts.init(dom);
var app = {};
option = null;
// app.title = '嵌套环形图';
option = {
title : {
text : '历史安全核查',
//subtext: '面积总数:970.00(㎡) 总藏书:51490(本)',
// x: 'center'
},
tooltip : {
trigger : 'axis',
axisPointer : {
type : 'cross',
crossStyle : {
color : '#999'
}
}
},
toolbox : {
feature : {
saveAsImage : {
show : true
}
}
},
color : [ '#8fc31f', '#f35833', '#00ccff' ],
legend : {
data : [ '核查台数', '接收台数', '反馈台数' ],
//bottom: 0
},
toolbox : { //工具栏(下载)
feature : {
saveAsImage : {}
},
right : '5%', //下载图标距右边框5%
},
grid : {
left : '3%',
right : '4%',
bottom : '3%',
containLabel : true
},
xAxis : [ {
/* axisLabel : {
rotate : 5,
interval : 0
}, */
type : 'category',
data : [ ${taskCheckSafeName} ],
axisPointer : {
type : 'shadow'
}
} ],
yAxis : [ {
type : 'value',
name : '台数',
min : 0,
//max: 50,
//interval: 400,
axisLabel : {
formatter : '{value}'
},
nameLocation : 'center',
nameGap : 65
} ],
series : [ {
name : '核查台数',
type : 'bar',
data : ${checkNumlist},
barWidth : '25%'
}, {
name : '接收台数',
type : 'bar',
data : ${receiveNumlist},
barWidth : '25%'
}, {
name : '反馈台数',
type : 'bar',
data : ${backNumlist},
barWidth : '25%'
}
]
};
if (option && typeof option === "object") {
myChart.setOption(option, true);
}
//柱状图end
//折线图start
var lines = echarts.init(document.getElementById('lines'));
//lines.showLoading(); //加载动画
linesSum = {
title : {
text: '历史告警'
},
tooltip : {
trigger: 'axis'
},
legend: {
data:[${legend}]
},
toolbox: {
show : true,
feature : {
saveAsImage : {show: true}
},
right : '5%',
},
calculable : true,
xAxis : [
{
type : 'category',
boundaryGap : false,
data : [${xAxis}]
}
],
yAxis : [
{
type : 'value'
}
],
series : [
${series}
]
};
lines.setOption(linesSum);
//折线图end
</script>
</div>
</body>
</html>Action代码:(部分)折线图的
List proTerminalSum = terminalService.queryAlarmSum(task);
		String xAxis="";
		String legend="";
		String series="";
		/*int a = 0;
		int b = 50;
		int c = 100;*/
		if (proTerminalSum.size() > 0) {
			Map<String,String> timetemp=new HashMap<String,String>();
			Map<String,String> orgtemp=new HashMap<String,String>();
			Map<String,String> valuetemp=new HashMap<String,String>();

			for(int i=0;i<proTerminalSum.size();i++){
				Object[] taskList = (Object[]) proTerminalSum.get(i);


				orgtemp.put(taskList[0].toString(), taskList[1].toString());
				timetemp.put(taskList[2].toString(), taskList[2].toString());
				valuetemp.put(taskList[0].toString()+taskList[2].toString(), taskList[3].toString());

			}
			String[] timestr=new String[timetemp.keySet().size()];

			int cn=0;
			for (String key : timetemp.keySet()) {
				timestr[cn]=key;
				cn+=1;
			}

			Arrays.sort(timestr);
			for(int i=0;i<timestr.length;i++){

				//判断timestr的长度是否为1 ,将这个数据取出来,找到他的前一天
				if(timestr.length == 1){
					String time = timestr[0];
					//字符串转Date类型
					 SimpleDateFormat sdf = new SimpleDateFormat("yyyy-MM-dd");
				       Date date =  sdf.parse(time);

					//计算出date类型的数据的前一天
					   Calendar c = Calendar.getInstance();
					   c.setTime(date);
					   c.add(Calendar.DAY_OF_MONTH, -1);
					   Date yesterday = c.getTime();//这是前一天

					   //将Date类型转化为String类型的存进x坐标轴中
					 String yesterdayString =  sdf.format(yesterday);
//					   System.out.println(yesterdayString);
					   xAxis+="'"+yesterdayString+"',";    //存入到X坐标中

				}

				xAxis+="'"+timestr[i]+"',";
			}
			for(String key : orgtemp.keySet()){

				legend+="'"+orgtemp.get(key)+"',";

				series+="{name:'"+orgtemp.get(key)+"',type:'line',smooth:true,itemStyle: {normal: {"
						//+ "color : 'rgb("+a+","+b+","+c+")',"
						+ "areaStyle: {type: 'default'}}},data:[";

				//如果查出来的记录只有一条,给日期加一个月初,值为0(只有一条数据时,显示的为一个点,加个零节点)
				if(proTerminalSum.size() == 1){
					//xAxis+="'2019-01-01',";   //这个是写死的月初,打算显示那一条数据的日期,并将它的前一天数据置为0
				//	xAxis+="'2019-01-01',";


					series+="0,";   //将数据置为0
					for(int i=0;i<timestr.length;i++){
						if(valuetemp.get(key+timestr[i])!=null){
					series+=valuetemp.get(key+timestr[i])+",";
						}}
				}else{//end

				for(int i=0;i<timestr.length;i++){
					if(valuetemp.get(key+timestr[i])!=null){
						series+=valuetemp.get(key+timestr[i])+",";
					}else{
						series+="0,";
					}
				}
				}
				series.substring(0, series.length()-1);
				series+="]},";
			/*	a += 100;
				b += 100;
				c += 50;*/
			}
			if(xAxis.length()>0)
				xAxis.substring(0, xAxis.length()-1);
			if(legend.length()>0)
				legend.substring(0, legend.length()-1);
			if(series.length()>0)
				series.substring(0, series.length()-1);

		}

		//折线图end
		// 折线图

		request.setAttribute("xAxis", xAxis);
		request.setAttribute("legend", legend);
		request.setAttribute("series", series);
		return "layout/nav";