版权声明:本文为博主原创文章,未经博主允许不得转载。 https://blog.csdn.net/rosefun96/article/details/86426048
1 理论
RBF网络就是使用一组径向基进行拟合。
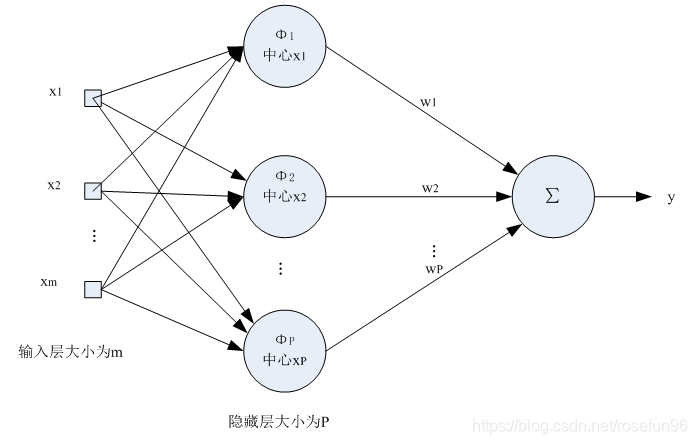

有了这个思想,我们可以看这个网络的细节部分。
1.1 径向基是什么?
wiki给出好几种定义。其中
代表是范数,
可以看做中心点,
是每个训练样本。

1.2 径向基选几个来进行拟合函数?
一般是训练样本的个数。
1.3 拟合误差怎么算?
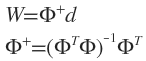
一般神经网络是,通过拟合误差来训练得到权值矩阵W。RBF是通过,
这里,
就是图中的
.
如果矩阵不是方阵,求的就是伪逆。
也就是,RBF网络直接用解方程的方式来获得W,不是常规计算拟合误差来求W。
2 实践
照搬链接的,有几行代码用numpy更简单地实现。
from scipy import *
from scipy.linalg import norm, pinv

from matplotlib import pyplot as plt
import numpy as np

class RBF:

    def __init__(self, indim, numCenters, outdim):
        self.indim = indim
        self.outdim = outdim
        self.numCenters = numCenters
        self.centers = [random.uniform(-1, 1, indim) for i in range(numCenters)]
        self.beta = 8
        self.W = random.random((self.numCenters, self.outdim))

    def _basisfunc(self, c, d):
        assert len(d) == self.indim
        return exp(-self.beta * norm(c-d)**2)

    def _calcAct(self, X):
        # calculate activations of RBFs
        G = zeros((X.shape[0], self.numCenters), float)
        for ci, c in enumerate(self.centers):
            for xi, x in enumerate(X):
                G[xi,ci] = self._basisfunc(c, x)
        return G

    def train(self, X, Y):
        """ X: matrix of dimensions n x indim
            y: column vector of dimension n x 1 """

        # choose random center vectors from training set
        random.seed(10)
#        rnd_idx = random.permutation(X.shape[0])[:self.numCenters]
#        self.centers = [X[i,:] for i in rnd_idx]
        self.centers = X[random.choice(X.shape[0],self.numCenters)]

#        print ("center", self.centers)
        # calculate activations of RBFs
        G = self._calcAct(X)
#        print ('G \n',G)

        # calculate output weights (pseudoinverse)
        self.W = dot(pinv(G), Y)
        return self.centers, G

    def test(self, X):
        """ X: matrix of dimensions n x indim """

        G = self._calcAct(X)
        Y = dot(G, self.W)
        return Y


if __name__ == '__main__':
    # ----- 1D Example ------------------------------------------------
    n = 100

#    x = mgrid[-1:1:complex(0,n)].reshape(n, 1)
    x = np.linspace(-1,1,n).reshape(n,1)
    # set y and add random noise
    y = sin(3*(x+0.5)**3 - 1)
    # y += random.normal(0, 0.1, y.shape)

    # rbf regression
    rbf = RBF(1, 10, 1)
    center, G = rbf.train(x, y)
    z = rbf.test(x)

    # plot original data
    plt.figure(figsize=(12, 8))
    plt.plot(x, y, 'k-')

    # plot learned model
    plt.plot(x, z, 'r-', linewidth=2)
#
    # plot rbfs
    plt.plot(rbf.centers, zeros(rbf.numCenters), 'gs')

    for c in rbf.centers:
        # RF prediction lines
        cx = arange(c-0.7, c+0.7, 0.01)
        cy = [rbf._basisfunc(array([cx_]), array([c])) for cx_ in cx]
        plt.plot(cx, cy, '-', color='gray', linewidth=0.2)

    plt.xlim(-1.2, 1.2)
    plt.show()
也可以用在分类的情况。
if __name__ == '__main__':
    # ----- 1D Example ------------------------------------------------
    n = 100
    def createData():
        iris = load_iris()
        df = pd.DataFrame(iris.data, columns = iris.feature_names)
        df['label'] = iris.target
        df.columns = ['sepal length', 'sepal width', 'petal length', 'petal width',
                      'label']
        return df.iloc[:,2],df.iloc[:,-1]

    x,y = createData()
    x = np.array(x).reshape(-1,1)

    from sklearn import preprocessing
    one_hot = preprocessing.OneHotEncoder(sparse = False)
    y = one_hot.fit_transform(np.array(y).reshape(-1,1))

    # rbf classification
    rbf = RBF(1, 10, 1)
    center, G = rbf.train(x, y)
    z = rbf.test(x)

    # plot original data
    plt.figure(figsize=(12, 8))
    y_l= np.argmax(y, axis = 1)
    plt.scatter(x, y_l )
    plt.show()

    plt.figure(figsize=(12, 8))
    # plot learned model
    plt.scatter(x, np.argmax(z,axis = 1))

    plt.show()
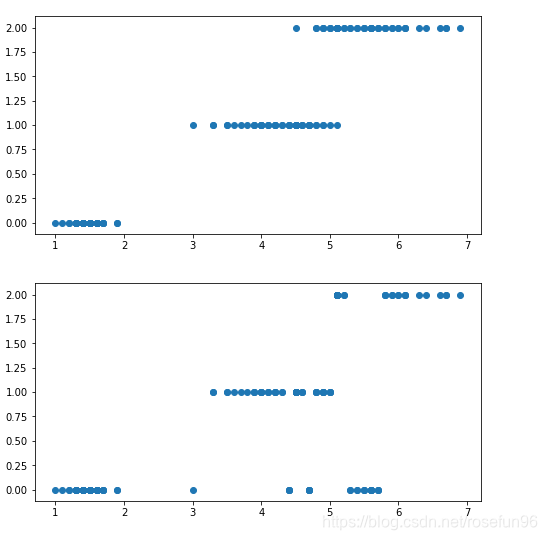
一维的RBF效果不是很好。
reference: