https://blog.csdn.net/qq_34806812/article/details/81459982
看了好几个博客,发现了些问题,有些博客是有bug的,此博客亲测无误。
可视化中间参数需要用到训练时保存的log文件(命令中的路径根据自己实际修改):
./darknet detector train pds/fish/cfg/fish.data pds/fish/cfg/yolov3-fish.cfg darknet53.conv.74 2>1 | tee visualization/train_yolov3.log
在使用脚本绘制变化曲线之前,需要先使用extract_log.py脚本,格式化log,用生成的新的log文件供可视化工具绘图,格式化log的extract_log.py脚本如下(和生成的log文件同一目录):
-
# coding=utf-8
-
# 该文件用来提取训练log,去除不可解析的log后使log文件格式化,生成新的log文件供可视化工具绘图
-
-
import inspect
-
import os
-
import random
-
import sys
-
def extract_log(log_file,new_log_file,key_word):
-
with open(log_file,
'r')
as f:
-
with open(new_log_file,
'w')
as train_log:
-
#f = open(log_file)
-
#train_log = open(new_log_file, 'w')
-
for line
in f:
-
# 去除多gpu的同步log
-
if
'Syncing'
in line:
-
continue
-
# 去除除零错误的log
-
if
'nan'
in line:
-
continue
-
if key_word
in line:
-
train_log.write(line)
-
f.close()
-
train_log.close()
-
-
extract_log(
'train_yolov3.log',
'train_log_loss.txt',
'images')
-
extract_log(
'train_yolov3.log',
'train_log_iou.txt',
'IOU')
运行之后,会解析log文件的loss行和iou行得到两个txt文件
使用train_loss_visualization.py脚本可以绘制loss变化曲线
train_loss_visualization.py脚本如下(也是同一目录新建py文件):
-
import pandas
as pd
-
import numpy
as np
-
import matplotlib.pyplot
as plt
-
#%matplotlib inline
-
-
lines =
5124
#改为自己生成的train_log_loss.txt中的行数
-
result = pd.read_csv(
'train_log_loss.txt', skiprows=[x
for x
in range(lines)
if ((x%
10!=
9) |(x<
1000))] ,error_bad_lines=
False, names=[
'loss',
'avg',
'rate',
'seconds',
'images'])
-
result.head()
-
-
result[
'loss']=result[
'loss'].str.split(
' ').str.get(
1)
-
result[
'avg']=result[
'avg'].str.split(
' ').str.get(
1)
-
result[
'rate']=result[
'rate'].str.split(
' ').str.get(
1)
-
result[
'seconds']=result[
'seconds'].str.split(
' ').str.get(
1)
-
result[
'images']=result[
'images'].str.split(
' ').str.get(
1)
-
result.head()
-
result.tail()
-
-
# print(result.head())
-
# print(result.tail())
-
# print(result.dtypes)
-
-
print(result[
'loss'])
-
print(result[
'avg'])
-
print(result[
'rate'])
-
print(result[
'seconds'])
-
print(result[
'images'])
-
-
result[
'loss']=pd.to_numeric(result[
'loss'])
-
result[
'avg']=pd.to_numeric(result[
'avg'])
-
result[
'rate']=pd.to_numeric(result[
'rate'])
-
result[
'seconds']=pd.to_numeric(result[
'seconds'])
-
result[
'images']=pd.to_numeric(result[
'images'])
-
result.dtypes
-
-
-
fig = plt.figure()
-
ax = fig.add_subplot(
1,
1,
1)
-
ax.plot(result[
'avg'].values,label=
'avg_loss')
-
# ax.plot(result['loss'].values,label='loss')
-
ax.legend(loc=
'best')
#图列自适应位置
-
ax.set_title(
'The loss curves')
-
ax.set_xlabel(
'batches')
-
fig.savefig(
'avg_loss')
-
# fig.savefig('loss')
修改train_loss_visualization.py中lines为train_log_loss.txt行数,并根据需要修改要跳过的行数:
skiprows=[x for x in range(lines) if ((x%10!=9) |(x<1000))]
运行train_loss_visualization.py会在脚本所在路径生成avg_loss.png。
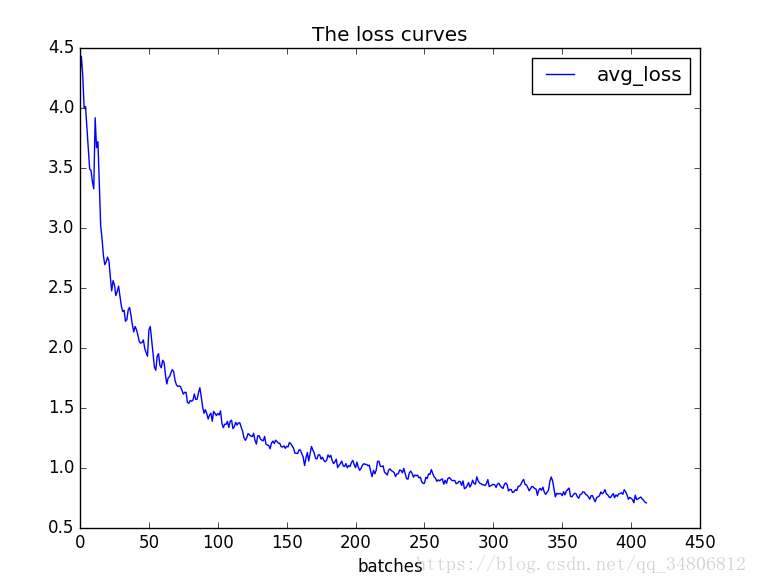
可以通过分析损失变化曲线,修改cfg中的学习率变化策略。
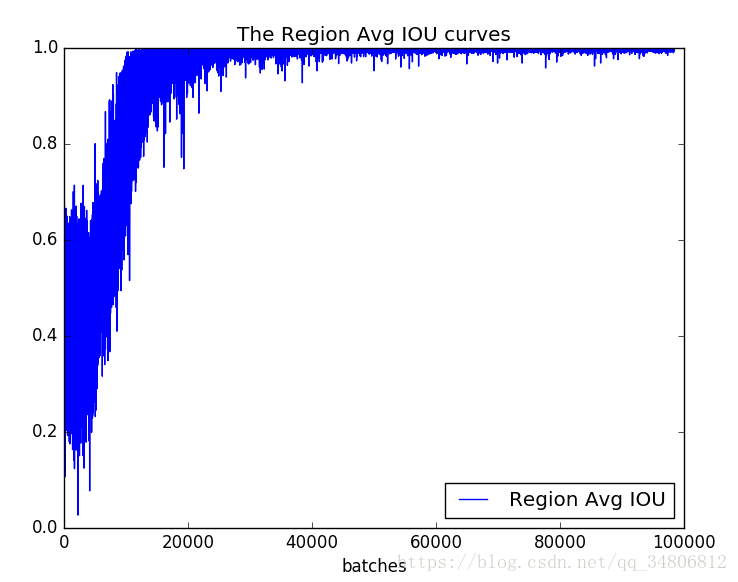
除了可视化loss,还可以可视化Avg IOU,Avg Recall等参数
可视化’Region Avg IOU’, ‘Class’, ‘Obj’, ‘No Obj’, ‘Avg Recall’,’count’这些参数可以使用脚本train_iou_visualization.py,使用方式和train_loss_visualization.py相同,train_iou_visualization.py脚本如下(#lines根据train_log_iou.txt的行数修改):
-
import pandas
as pd
-
import numpy
as np
-
import matplotlib.pyplot
as plt
-
#%matplotlib
inline
-
-
lines =
122956 #根据train_log_iou.txt的行数修改
-
result = pd.read_csv(
'train_log_iou.txt', skiprows=[x
for x
in range(lines)
if (x%
10==
0 or x%
10==
9) ] ,error_bad_lines=False, names=[
'Region Avg IOU',
'Class',
'Obj',
'No Obj',
'Avg Recall',
'count'])
-
result.head()
-
-
result[
'Region Avg IOU']=result[
'Region Avg IOU'].str.split(
': ').str.
get(
1)
-
result[
'Class']=result[
'Class'].str.split(
': ').str.
get(
1)
-
result[
'Obj']=result[
'Obj'].str.split(
': ').str.
get(
1)
-
result[
'No Obj']=result[
'No Obj'].str.split(
': ').str.
get(
1)
-
result[
'Avg Recall']=result[
'Avg Recall'].str.split(
': ').str.
get(
1)
-
result[
'count']=result[
'count'].str.split(
': ').str.
get(
1)
-
result.head()
-
result.tail()
-
-
# print(result.head())
-
# print(result.tail())
-
# print(result.dtypes)
-
print(result[
'Region Avg IOU'])
-
-
result[
'Region Avg IOU']=pd.to_numeric(result[
'Region Avg IOU'])
-
result[
'Class']=pd.to_numeric(result[
'Class'])
-
result[
'Obj']=pd.to_numeric(result[
'Obj'])
-
result[
'No Obj']=pd.to_numeric(result[
'No Obj'])
-
result[
'Avg Recall']=pd.to_numeric(result[
'Avg Recall'])
-
result[
'count']=pd.to_numeric(result[
'count'])
-
result.dtypes
-
-
fig = plt.figure()
-
ax = fig.add_subplot(
1,
1,
1)
-
ax.plot(result[
'Region Avg IOU'].values,label=
'Region Avg IOU')
-
# ax.plot(result[
'Class'].values,label=
'Class')
-
# ax.plot(result[
'Obj'].values,label=
'Obj')
-
# ax.plot(result[
'No Obj'].values,label=
'No Obj')
-
# ax.plot(result[
'Avg Recall'].values,label=
'Avg Recall')
-
# ax.plot(result[
'count'].values,label=
'count')
-
ax.legend(loc=
'best')
-
# ax.set_title(
'The Region Avg IOU curves')
-
ax.set_title(
'The Region Avg IOU curves')
-
ax.set_xlabel(
'batches')
-
# fig.savefig(
'Avg IOU')
-
fig.savefig(
'Region Avg IOU')
运行train_iou_visualization.py会在脚本所在路径生成相应的曲线图。
参考:
https://blog.csdn.net/yudiemiaomiao/article/details/72469135
https://blog.csdn.net/cgt19910923/article/details/80783614
https://blog.csdn.net/cgt19910923/article/details/80783614#commentBox
***20181113***
评论区的一位做的表格很棒,很值得借鉴学习:
https://blog.csdn.net/qq_33614902/article/details/83418441
一、extract_log.py
-
#!/usr/bin/python
-
#coding=utf-8
-
#该文件用于提取训练log,去除不可解析的log后使log文件格式化,生成新的log文件供可视化工具绘图
-
import inspect
-
import os
-
import random
-
import sys
-
def extract_log(log_file, new_log_file, key_word):
-
with open(log_file,
'r')
as f:
-
with open(new_log_file,
'w')
as train_log:
-
for line
in f:
-
#去除多GPU的同步log;去除除零错误的log
-
if (
'Syncing'
in line)
or (
'nan'
in line):
-
continue
-
if key_word
in line:
-
train_log.write(line)
-
f.close()
-
train_log.close()
-
-
extract_log(
'./2048/train_log2.txt',
'./2048/log_loss2.txt',
'images')
-
extract_log(
'./2048/train_log2.txt',
'log_iou2.txt',
'IOU')
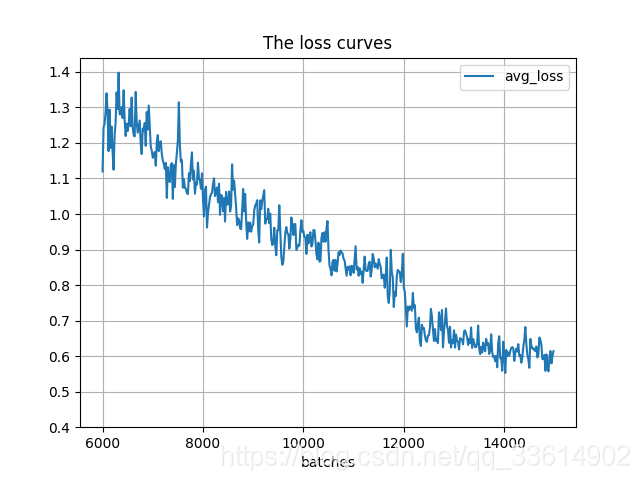
二、visualization_loss.py
-
#!/usr/bin/python
-
#coding=utf-8
-
-
import pandas
as pd
-
import numpy
as np
-
import matplotlib.pyplot
as plt
-
-
-
#根据自己的log_loss.txt中的行数修改lines, 修改训练时的迭代起始次数(start_ite)和结束次数(end_ite)。
-
lines =
4500
-
start_ite =
6000
#log_loss.txt里面的最小迭代次数
-
end_ite =
15000
#log_loss.txt里面的最大迭代次数
-
step =
10
#跳行数,决定画图的稠密程度
-
igore =
0
#当开始的loss较大时,你需要忽略前igore次迭代,注意这里是迭代次数
-
-
-
y_ticks = [
0.4,
0.5,
0.6,
0.7,
0.8,
0.9,
1.0,
1.1,
1.2,
1.3,
1.4]
#纵坐标的值,可以自己设置。
-
data_path =
'2048/log_loss2.txt'
#log_loss的路径。
-
result_path =
'./2048/avg_loss'
#保存结果的路径。
-
-
####-----------------只需要改上面的,下面的可以不改动
-
names = [
'loss',
'avg',
'rate',
'seconds',
'images']
-
result = pd.read_csv(data_path, skiprows=[x
for x
in range(lines)
if (x<lines*
1.0/((end_ite - start_ite)*
1.0)*igore
or x%step!=
9)], error_bad_lines=\
-
False, names=names)
-
result.head()
-
for name
in names:
-
result[name] = result[name].str.split(
' ').str.get(
1)
-
-
result.head()
-
result.tail()
-
-
for name
in names:
-
result[name] = pd.to_numeric(result[name])
-
result.dtypes
-
print(result[
'avg'].values)
-
-
fig = plt.figure()
-
ax = fig.add_subplot(
1,
1,
1)
-
-
-
###-----------设置横坐标的值。
-
x_num = len(result[
'avg'].values)
-
tmp = (end_ite-start_ite - igore)/(x_num*
1.0)
-
x = []
-
for i
in range(x_num):
-
x.append(i*tmp + start_ite + igore)
-
#print(x)
-
print(
'total = %d\n' %x_num)
-
print(
'start = %d, end = %d\n' %(x[
0], x[
-1]))
-
###----------
-
-
-
ax.plot(x, result[
'avg'].values, label=
'avg_loss')
-
#ax.plot(result['loss'].values, label='loss')
-
plt.yticks(y_ticks)
#如果不想自己设置纵坐标,可以注释掉。
-
plt.grid()
-
ax.legend(loc =
'best')
-
ax.set_title(
'The loss curves')
-
ax.set_xlabel(
'batches')
-
fig.savefig(result_path)
-
#fig.savefig('loss')
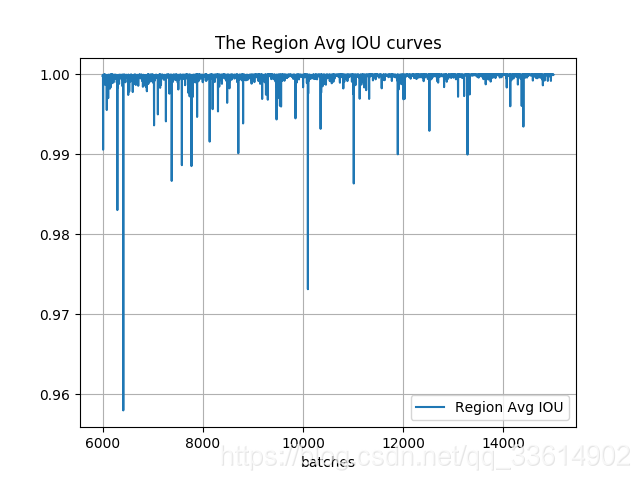
三、visualization_iou.py
-
#!/usr/bin/python
-
#coding=utf-8
-
-
import pandas
as pd
-
import numpy
as np
-
import matplotlib.pyplot
as plt
-
-
#根据log_iou修改行数
-
lines =
1736397
-
step =
5000
-
start_ite =
0
-
end_ite =
50200
-
igore =
1000
-
data_path =
'./my_coco3/log_iou.txt'
#log_loss的路径。
-
result_path =
'./my_coco3/Region Avg IOU'
#保存结果的路径。
-
-
names = [
'Region Avg IOU',
'Class',
'Obj',
'No Obj',
'.5_Recall',
'.7_Recall',
'count']
-
#result = pd.read_csv('log_iou.txt', skiprows=[x for x in range(lines) if (x%10==0 or x%10==9)]\
-
result = pd.read_csv(data_path, skiprows=[x
for x
in range(lines)
if (x<lines*
1.0/((end_ite - start_ite)*
1.0)*igore
or x%step!=
0)]\
-
, error_bad_lines=
False, names=names)
-
result.head()
-
-
for name
in names:
-
result[name] = result[name].str.split(
': ').str.get(
1)
-
result.head()
-
result.tail()
-
for name
in names:
-
result[name] = pd.to_numeric(result[name])
-
result.dtypes
-
-
-
####--------------
-
x_num = len(result[
'Region Avg IOU'].values)
-
tmp = (end_ite-start_ite - igore)/(x_num*
1.0)
-
x = []
-
for i
in range(x_num):
-
x.append(i*tmp + start_ite + igore)
-
#print(x)
-
print(
'total = %d\n' %x_num)
-
print(
'start = %d, end = %d\n' %(x[
0], x[
-1]))
-
####-------------
-
-
-
fig = plt.figure()
-
ax = fig.add_subplot(
1,
1,
1)
-
ax.plot(x, result[
'Region Avg IOU'].values, label=
'Region Avg IOU')
-
#ax.plot(result['Avg Recall'].values, label='Avg Recall')
-
plt.grid()
-
ax.legend(loc=
'best')
-
ax.set_title(
'The Region Avg IOU curves')
-
ax.set_xlabel(
'batches')
-
fig.savefig(result_path)