版权声明:转载记得宣传奥~。~ https://blog.csdn.net/c_ym_ww/article/details/88292958
文章目录
基于JDK命令行工具的监控
JVM的参数类型
-
标准参数
- -help
- -server -client
- -version -showversion
- -cp -classpath
-
X参数:非标准化参数
- -Xint: 完全解释执行,不生成JIT本地代码
- -Xcomp:第一次使用就编译成 本地代码
- -Xmixed:混合模式,JVM自己来决定是否编译成 本地代码
-
XX参数:非标准化参数,相对不稳定,主要用于JVM调优和Debug
-
boolean类型
-
格式:-XX:[+-]<name>表示启动或者禁用name属性 比如:-XX:+UseConcMarkSweepGC -XX:+UseG1GC -
非Boolean类型
-
格式:-XX:<name>=<value>表示name属性的值是value 比如:-XX:MaxGCPauseMillis=500 -XX:GCTimeRatio=19 -
-Xms等价于-XX:InitialHeapSize 初始化堆大小
-
-Xmx等价于-XX:MaxHeapSize 最大堆大小
-
运行时JVM参数查看:jinfo -flags pid
-
-XX:+PrintFlagsInitial:java -XX:+PrintFlagsInitial -version
-
=表示默认值
-
:=被用户或者JVM修改后的值
-
jinfo举例:
查看最大内存:jinfo -flag MaxHeapSize pid
查看垃圾回收器: jinfo -flag UseConcMarkSweepGC pid
              jinfo -flag UseG1GC pid
              jinfo -flag UseParallelGC pid
-
-
-XX:+PrintFlagsFinal
-
-XX:UnlockExperimentalVMOptions 解锁实验参数
-
-XX:UnlockDiagnosticVMOptions 解锁诊断参数
-
-XX:+PrintCommandLineFlags 打印命令行参数
jstat查看虚拟机统计信息
-
类加载
-
jstat -class pid 1000(毫秒) 10(输出10行)
-
-class option
Class loader statistics.

Loaded: Number of classes loaded.

Bytes: Number of kBs loaded.

Unloaded: Number of classes unloaded.

Bytes: Number of Kbytes unloaded.

Time: Time spent performing class loading and unloading operations.
-
-
垃圾收集:-gc,-gcutil,-gccause,-gcnew,-gcold
-
jstat -gc pid
-
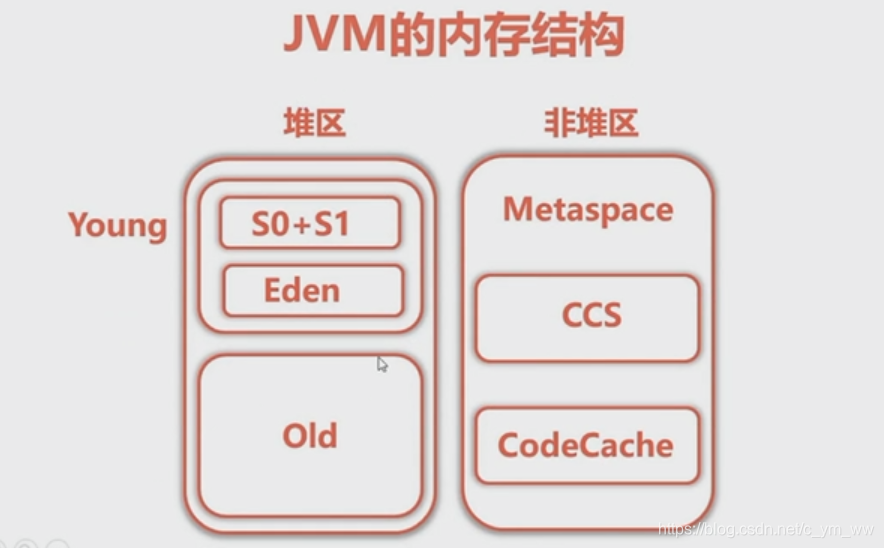
-gc option
Garbage-collected heap statistics.

S0C: Current survivor space 0 capacity (kB). S0,S1的总量

S1C: Current survivor space 1 capacity (kB).

S0U: Survivor space 0 utilization (kB).S0,S1的使用量

S1U: Survivor space 1 utilization (kB).

EC: Current eden space capacity (kB).Eden区的总量

EU: Eden space utilization (kB).Eden区的使用量

OC: Current old space capacity (kB). Old区总量

OU: Old space utilization (kB).Old区使用量

MC: Metaspace capacity (kB).Metaspace区总量

MU: Metacspace utilization (kB).Metaspace区使用量

CCSC: Compressed class space capacity (kB).压缩类空间总量

CCSU: Compressed class space used (kB).压缩类空间使用量

YGC: Number of young generation garbage collection events.YoungGC的次数

YGCT: Young generation garbage collection time.YoungGC的时间

FGC: Number of full GC events.FullGC的次数

FGCT: Full garbage collection time.FullGC的时间

GCT: Total garbage collection time.总的GC时间
-
3. JIT编译:-compiler,-printcompilation
-
jstat -compiler pid
-
-compiler option
Java HotSpot VM Just-in-Time compiler statistics.

Compiled: Number of compilation tasks performed.

Failed: Number of compilations tasks failed.

Invalid: Number of compilation tasks that were invalidated.

Time: Time spent performing compilation tasks.

FailedType: Compile type of the last failed compilation.

FailedMethod: Class name and method of the last failed compilation.
jmap+MAT实战内存溢出
-
堆区溢出
/** * -Xmx32M -Xms32M **/ while(true){ list.add(); } -
非堆区溢出
/**asm自动创建class类 * -XX:MetaspaceSize=32M -XX:MaxMetaspaceSize=32M **/ while(true){ list.addAll(createClass()) } -
导出内存映像文件分析内存溢出原因:hprof文件
-
内存溢出自动导出:-XX:+HeapDumpOnOutOfMemoryError
-XX:HeapDumpPath=./ -
使用jmap命令手动导出
jmap -heap pid:可以查看各个区的详细情况
jmap -dump:format=b,file=heap.hprof pid
-
-
MAT分析内存溢出 下载MAT
下载之后导入hprof文件,使用MAT文件分析
jstack查看死循环与死锁
jstack简介
-
JAVA线程状态
NEW The thread has not yet started. RUNNABLE The thread is executing in the JVM. BLOCKED The thread is blocked waiting for a monitor lock. WAITING The thread is waiting indefinitely for another thread to perform a particular action. TIMED_WAITING The thread is waiting for another thread to perform an action for up to a specified waiting time. TERMINATED The thread has exited. 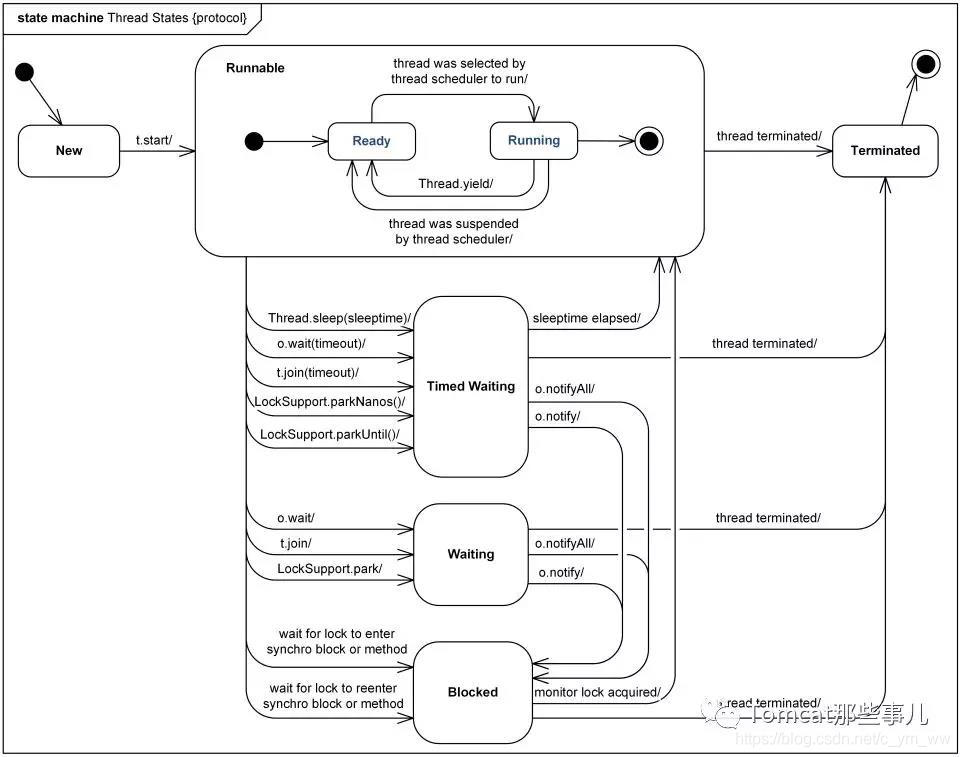
-
导出文件
jstack pid >pid.txt 结果导出到pid.txt文件
sz pid.txt 下载txt文件然后查看
print "%x" pid 转化为16进制,在pid.txt文件中具体查看
tail -f nohup.out  启动jar日志查看
死循环导致CPU飙高
- 死循环导致CPU飙高无法访问:转换16进制查看线程状态:RUNNABLE状态
- 死锁的情况:线程调用1之后等待1秒调用2,线程调用2之后等待1秒调用1,造成死锁