版权声明:本文为博主原创文章,未经博主允许不得转载。 https://blog.csdn.net/abc15766228491/article/details/88734507
由于论文需要,仓促之下安装了igraph,整理一下绘图过程,下次就不用再百度了。。。
igraph是一个用来绘制网络图的库,下面用football.gml文件举例,说明如何使用这个库。如有纰漏,望指正。
对于gml文件的读取,该库非常简单,代码如下:
g = igraph.Graph.Read_GML(filePath)
# 源代码如下
'''
  @classmethod
    def Read_GML(cls, f): # real signature unknown; restored from __doc__
        """
        Read_GML(f)

        Reads a GML file and creates a graph based on it.

        @param f: the name of the file or a Python file handle
        """
        pass
'''
从源代码注释(creates a graph based on it)理解,返回值应该是一个Graph类
通过检查gml文件,可以看到顶点属性有三个:id,label,value,分别对应改节点的编号,节点名称和节点类别。为了我们画图简洁,我们将顶点名称设置为空值,如果不设置,在图片上的顶点会有改顶点的名称出现。可以通过vs属性设置顶点的属性值,代码如下:
g.vs['label'] = ['']
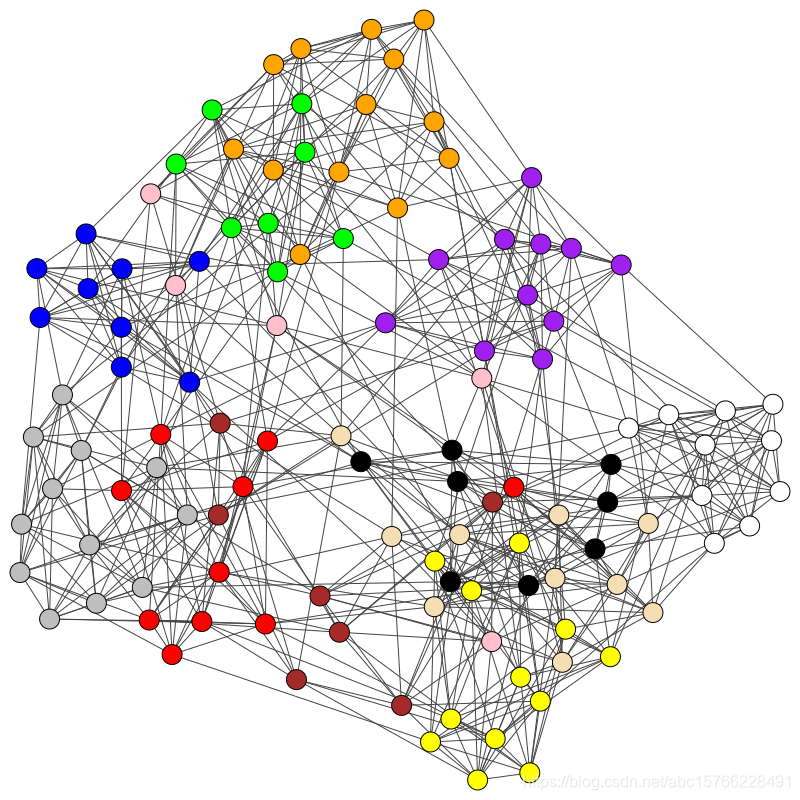
为了用不同颜色表示每个类,我们要设置visual_style字典,使用Python的map方法按照顶点的value返回一个List,表示每个顶点的颜色,代码如下:
def getValue(value):
    colorList = ['blue','green','purple','yellow','red','pink','orange','black','white','gray','brown','wheat']
    return colorList[int(value)]

visual_style = dict()
visual_style['vertex_color'] = list(map(getValue, (g.vs['value'])))
通过检查Graph.plot()的注释,可以得到visual_style全部的可以设置的属性,这里就不一一列举了
然后就是画图
igraph.plot(g, **visual_style)
全部绘制代码如下:
import igraph

filePath = 'file/football.gml'
imagePath = 'file/footbalImage.png'


def getValue(value):
    colorList = ['blue','green','purple','yellow','red','pink','orange','black','white','gray','brown','wheat']
    return colorList[int(value)]


g = igraph.Graph.Read_GML(filePath)

g.vs['label'] = ['']

visual_style = dict()
visual_style['vertex_color'] = list(map(getValue, (g.vs['value'])))
visual_style['bbox'] = [0, 0, 800, 800]

image = igraph.plot(g, **visual_style)
image.save(imagePath)
绘制结果如下: