版权声明:转载时请备注来源 https://blog.csdn.net/wangmeitingaa/article/details/82782442
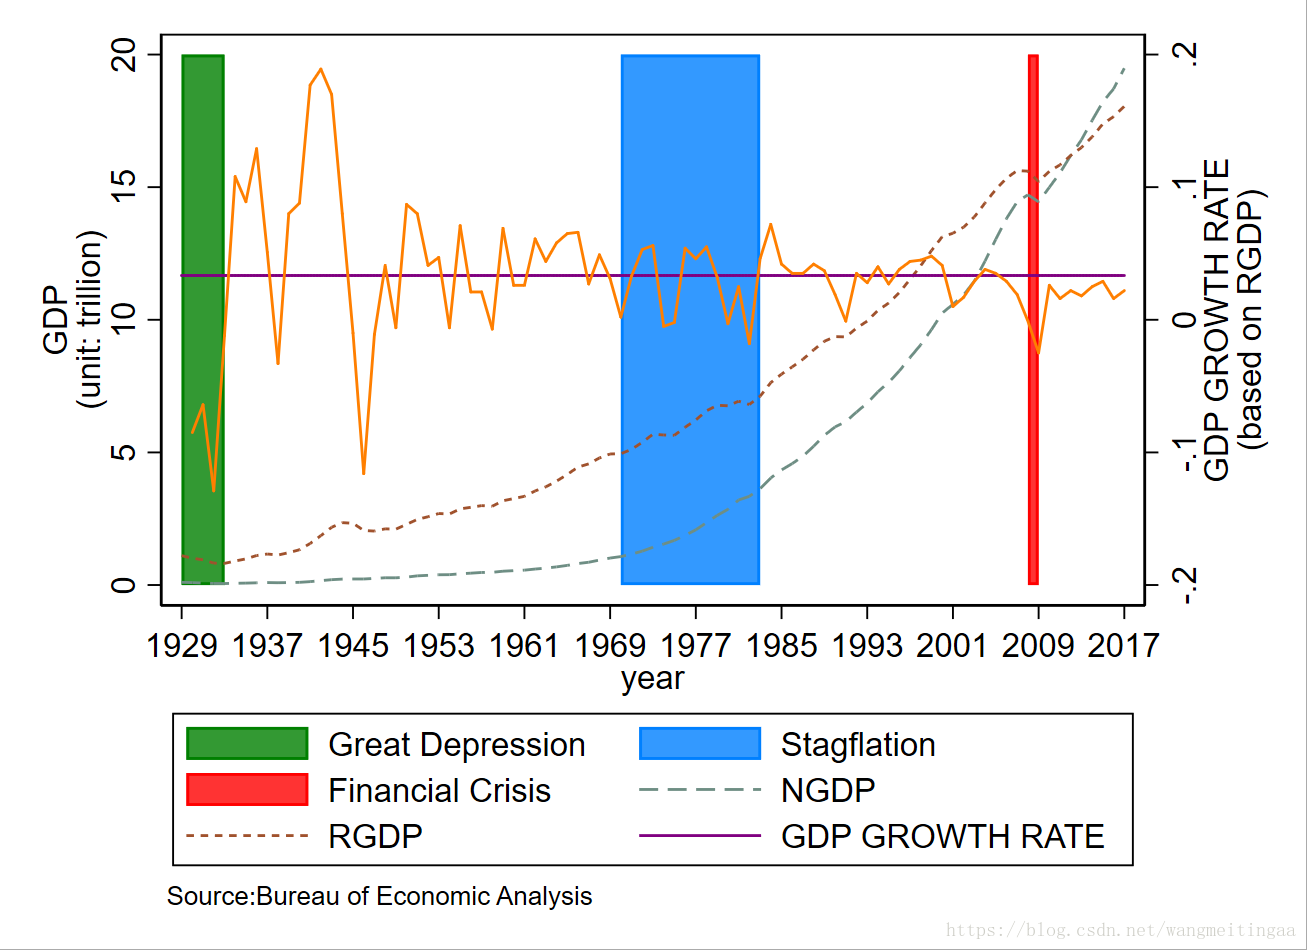
做US GDP相关的图
代码如下:
import excel us_gdp.xlsx, firstrow case(lower) clear
tsset year
label variable gdp_growth_rate "GDP GROWTH RATE"
twoway 								               ///
 function y=20,range(1929 1933) recast(area) color(green) base(0) yaxis(1)  || ///
 function y=20,range(1970 1983) recast(area) color(midblue) base(0) yaxis(1)|| ///
 function y=20,range(2008 2009) recast(area) color(red) base(0) yaxis(1)    || ///
 function y=0.0333977,range(1929 2017) yaxis(2) lcolor(purple)              || ///
 tsline ngdp,lp(dash) yaxis(1)  ytitle("GDP" "(unit: trillion)")            || ///
 tsline rgdp,lp(shortdash) yaxis(1)                                         || ///
 tsline gdp_growth_rate,yaxis(2)  xlabel(1929(8)2017)                          ///
   ytitle("GDP GROWTH RATE" "(based on RGDP)",axis(2)) xtitle("year")          ///
   legend(order(1 "Great Depression" 2 "Stagflation" 3 "Financial Crisis"      ///
   4 "NGDP" 5 "RGDP" 6 "GDP GROWTH RATE")) scheme(s1color)                     ///
   note("Source:Bureau of Economic Analysis")
 graph export us_gdp.pdf,replace
做出的图如下:
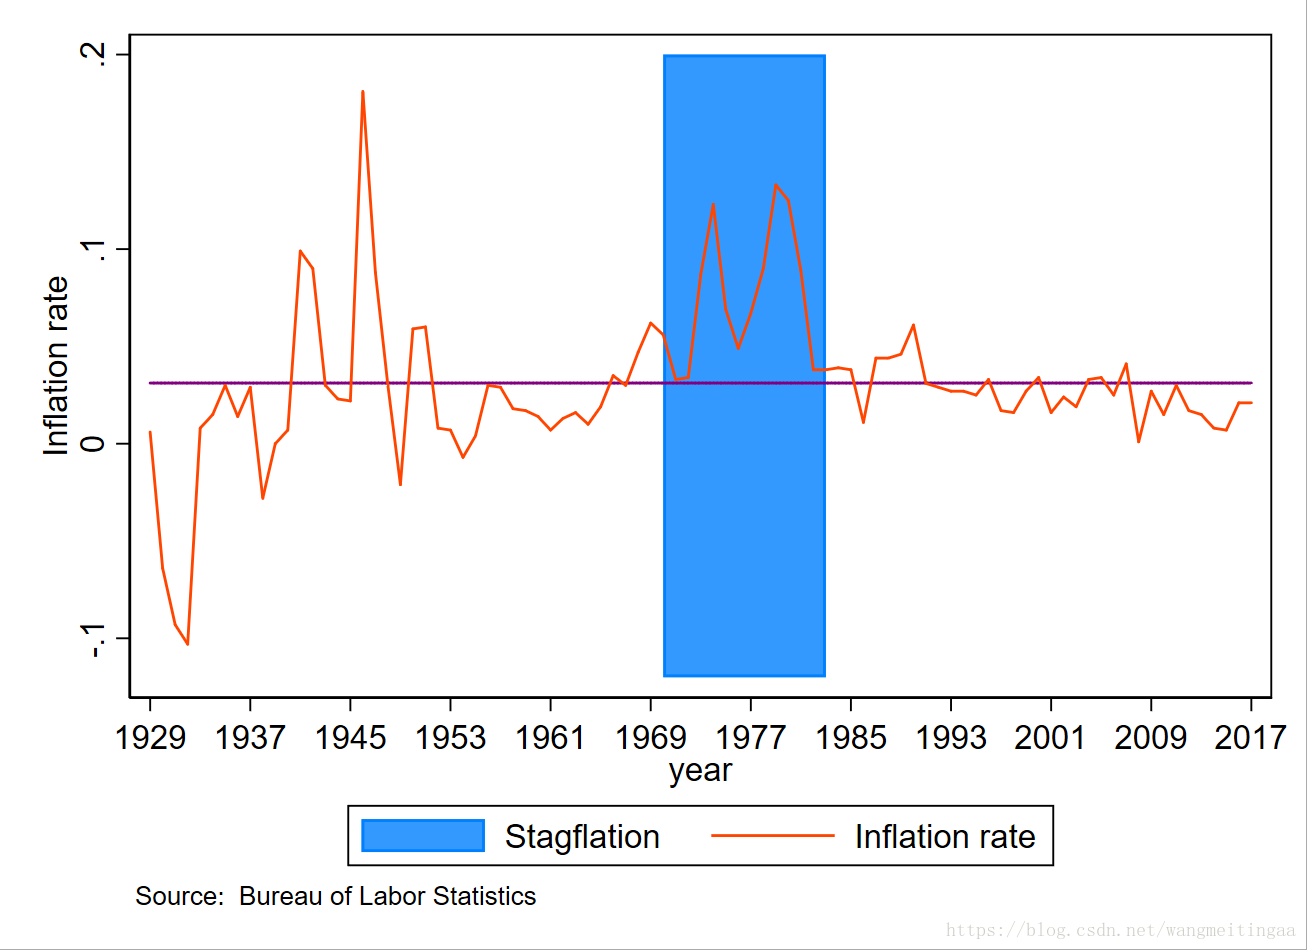
做US inflation相关的图
代码1
import excel us_infla_unr_gdpr.xlsx, firstrow case(lower) clear
rename inflation inflation_rate
label variable unr "Unemployment rate"
label variable gdp_rate "gdp growth rate"
label variable inflation_rate "Inflation rate"
tsset year
twoway                                                                      ///
 function y=0.2,range(1970 1983) recast(area) color(midblue) base(-0.12) || ///
 function y=0.0311798,range(1929 2017) lcolor(purple)                    || ///
 tsline inflation_rate,lcolor(orange_red) xlabel(1929(8)2017)               ///
 legend(order(1 "Stagflation" 3 "Inflation rate")) ytitle("Inflation rate") ///
 xtitle("year") note("Source:  Bureau of Labor Statistics")
graph export us_infla_0.pdf,replace
做出的图如下
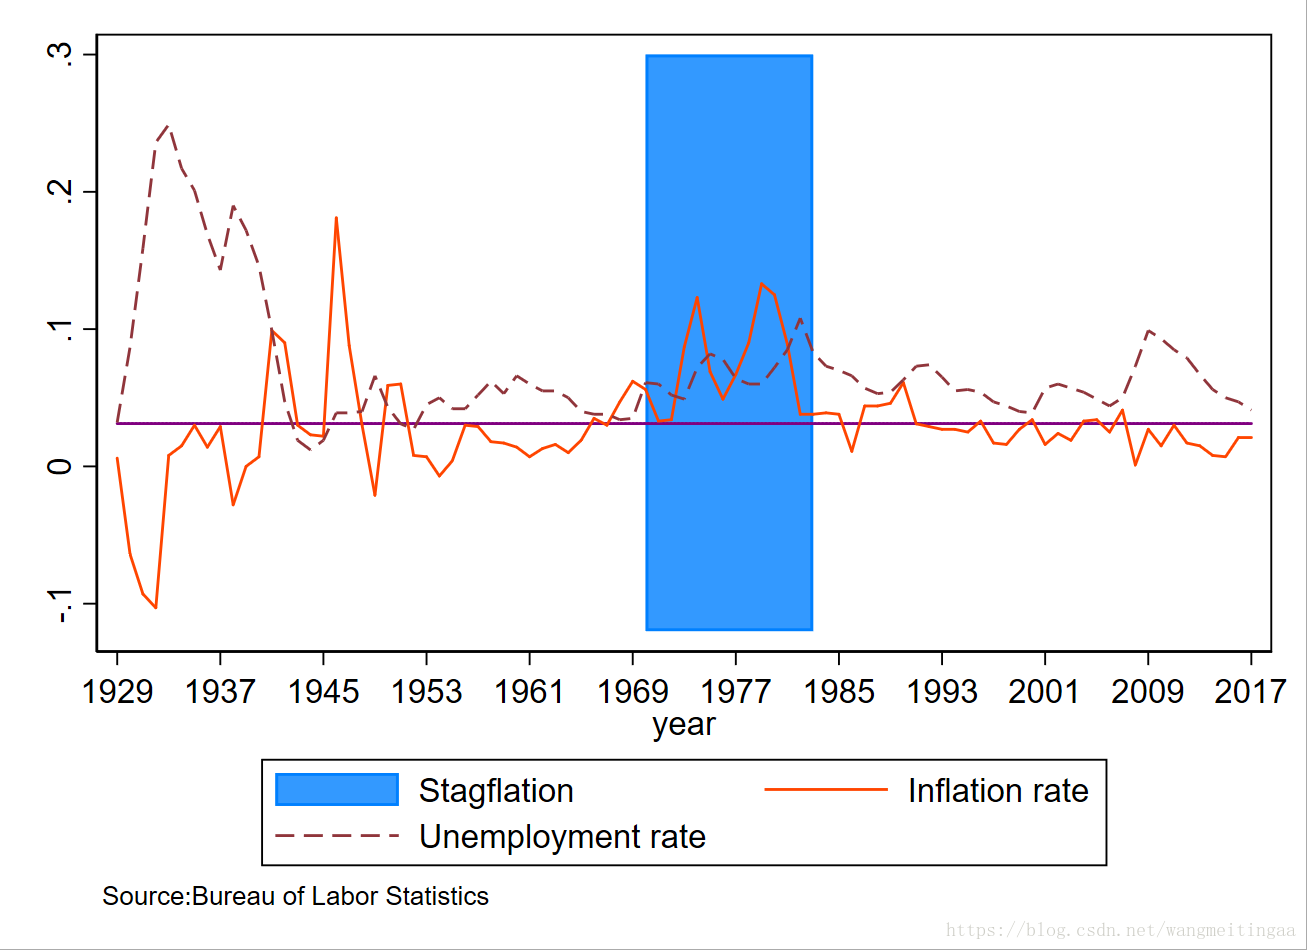
代码2
twoway                                                                           ///
 function y=0.3,range(1970 1983) recast(area) color(midblue) base(-0.12)     || ///
 function y=0.0311798,range(1929 2017) lcolor(purple)                       || ///
 tsline inflation_rate,lcolor(orange_red)                                  || ///
 tsline unr ,lp(dash) xlabel(1929(8)2017)                                    ///
 legend(order(1 "Stagflation" 3 "Inflation rate" 4 "Unemployment rate"))    ///
 xtitle("year") note("Source:Bureau of Labor Statistics")
graph export us_unr_infla_1.pdf,replace
做出的图如下
代码3
gen year1= real(substr(string(year),-2,.))
twoway connected inflation_rate unr if year>=1961 & year<=1990 ///
  ,mlabel(year1) note("Source:Bureau of Labor Statistics")
graph export us_unr_infla_2.pdf,replace
做出的图如下

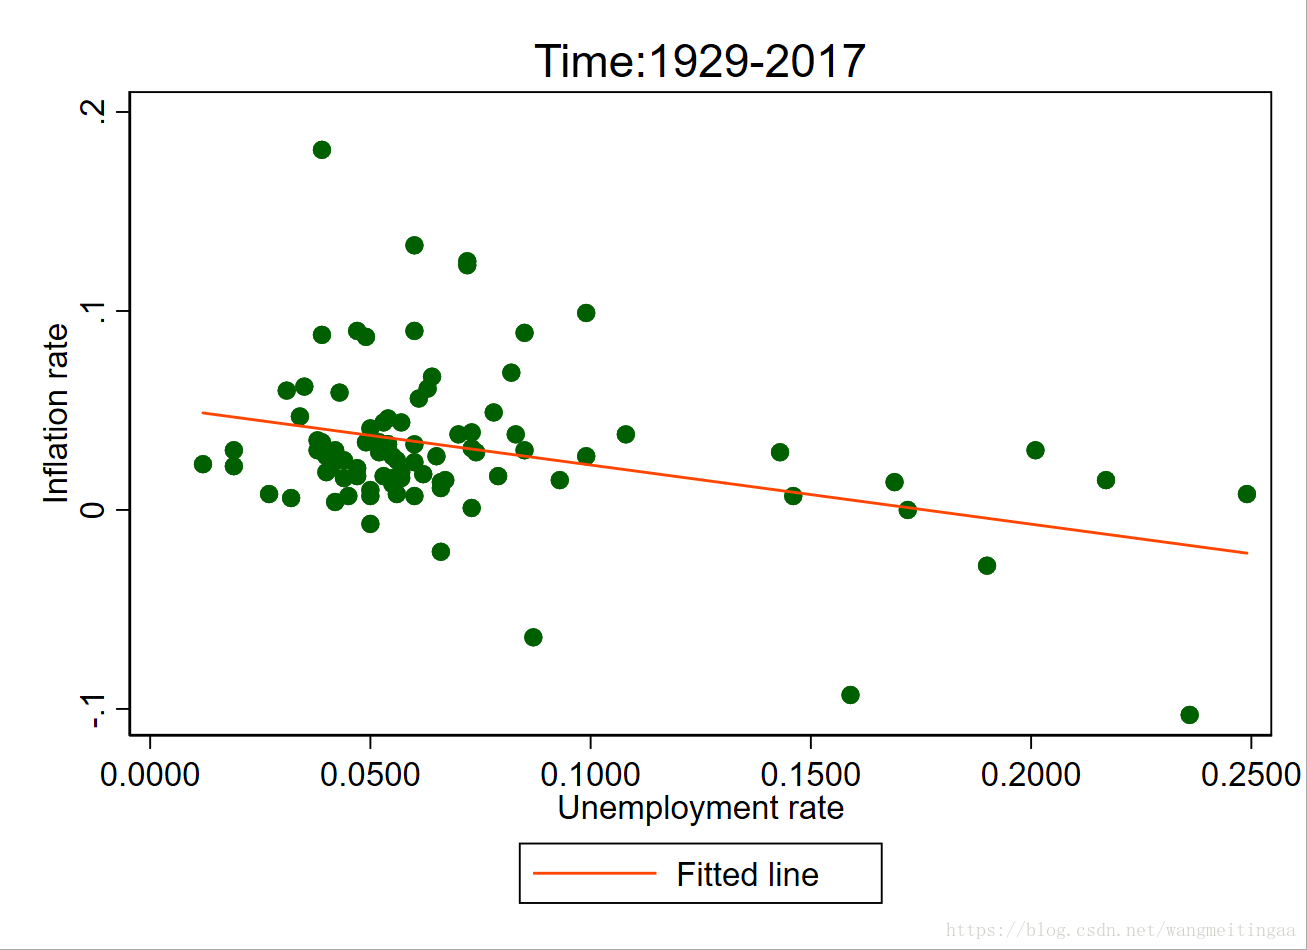
代码4
twoway scatter inflation_rate unr || lfit inflation_rate unr ,ytitle("Inflation rate") ///
 xtitle("Unemployment rate") title("Time:1929-2017") legend(order(2 "Fitted line"))
graph export us_unr_infla_3.pdf,replace
做出的图如下
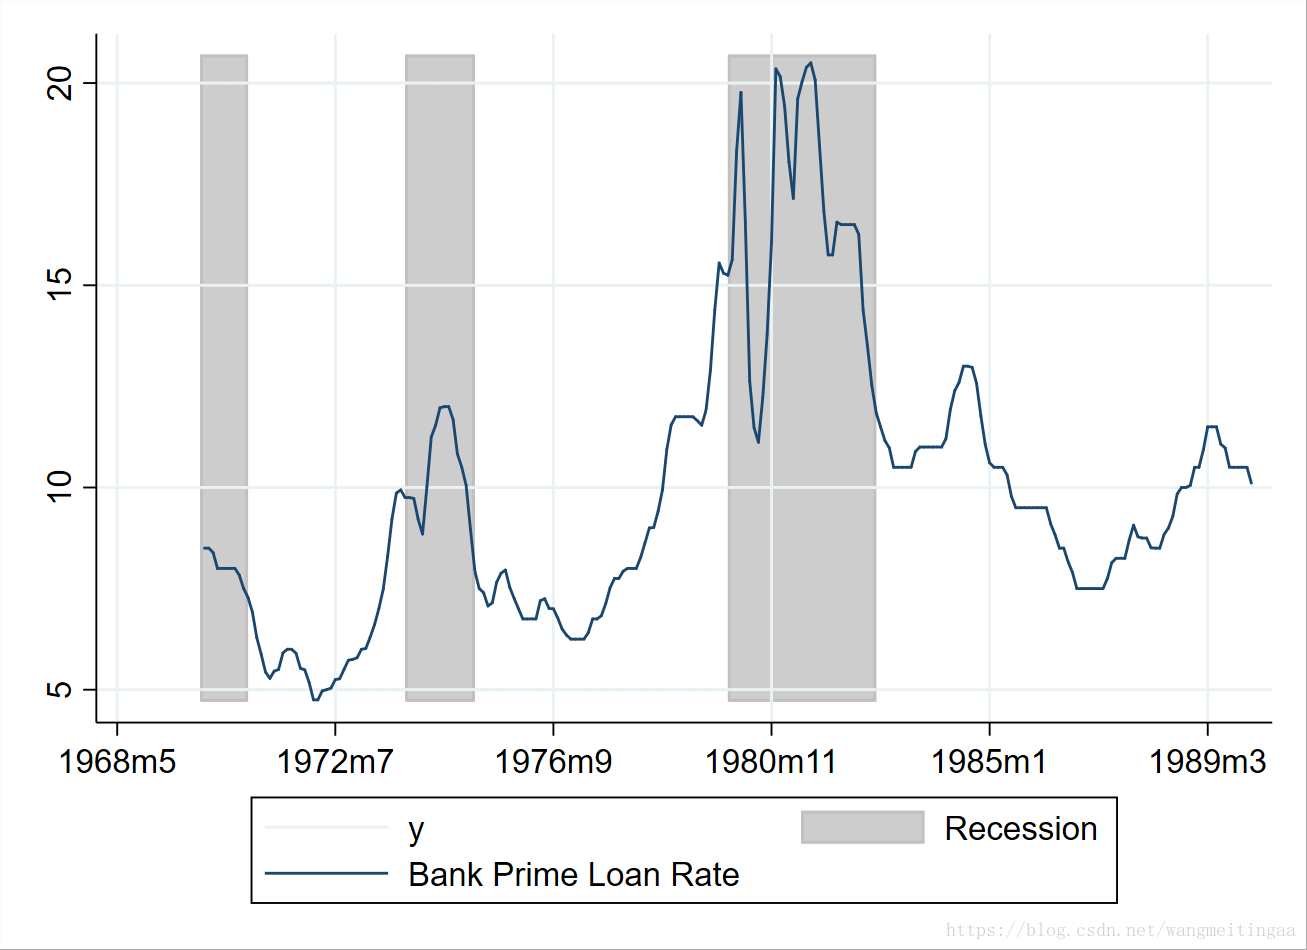
test 绘制区间阴影
代码如下
ssc install freduse, replace  //gets program online
freduse MPRIME, clear
generate ym = mofd(daten)
generate ym1 = mofd(daten)
tsset ym, monthly            //相当于同时设置了 format %tm ym
twoway                                                                     ///
 function y=20.705,range(119 130) recast(area) color(gs12) base(4.7025) || ///
 function y=20.705,range(166 182) recast(area) color(gs12) base(4.7025) || ///
 function y=20.705,range(240 274) recast(area) color(gs12) base(4.7025) || ///
 function y= 5    ,range(119 274) lstyle(grid)                          || ///
 function y=10    ,range(119 274) lstyle(grid)                          || ///
 function y=15    ,range(119 274) lstyle(grid)                          || ///
 function y=20    ,range(119 274) lstyle(grid)                          || ///
 function y=ym(1980,11), range(4.7025 20.705) horizontal lstyle(grid)   || ///
 tsline MPRIME if tin(1970m1,1990m1), xlabel(,format(%tm)) lstyle(p1)      ///
 legend(order(5 1 "Recession" 9)) tlabel(,grid) scheme(s2color) ///
 graphregion(color(white))
   //horizontal 表示水平作图
做出的图如下
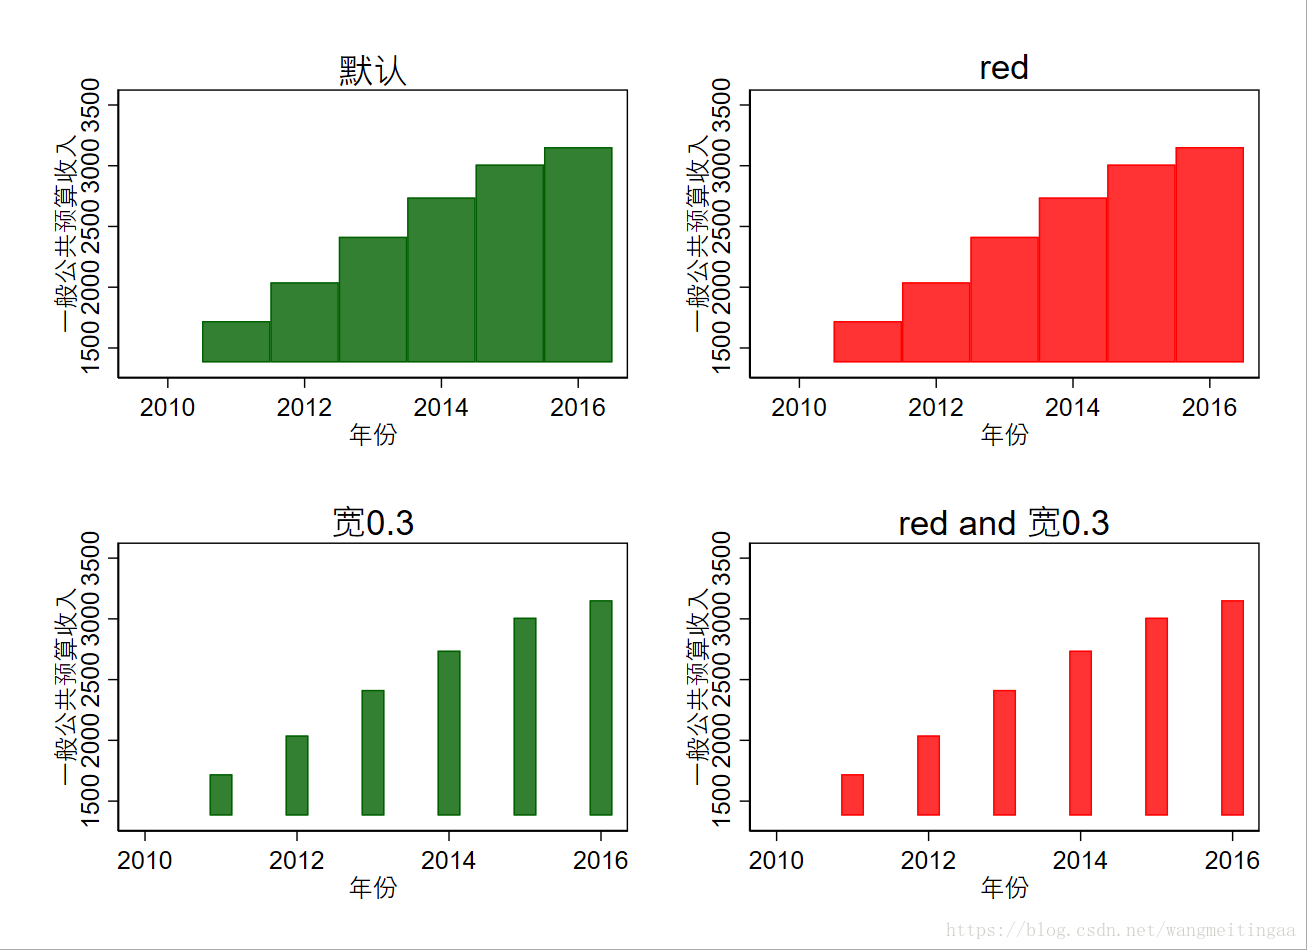
test 绘制美丽的柱状图
可参见该网页
代码1
import excel using bar_test.xlsx,firstrow clear
rename 一般公共预算收入 bu_re
label variable year "年份"
twoway bar bu_re year

  //(1)color(colorstyle)和barwidth(#)
twoway bar bu_re year,title("默认")
graph save bar,replace

twoway bar bu_re year,color(red) title("red")
graph save cnbar,replace

twoway bar bu_re year,barwidth(0.3) title("宽0.3")
graph save wnbar,replace

twoway bar bu_re year,color(red) barwidth(0.3) title("red and 宽0.3")
graph save cwnbar,replace

graph combine bar.gph cnbar.gph wnbar.gph cwnbar.gph
做出的图如下
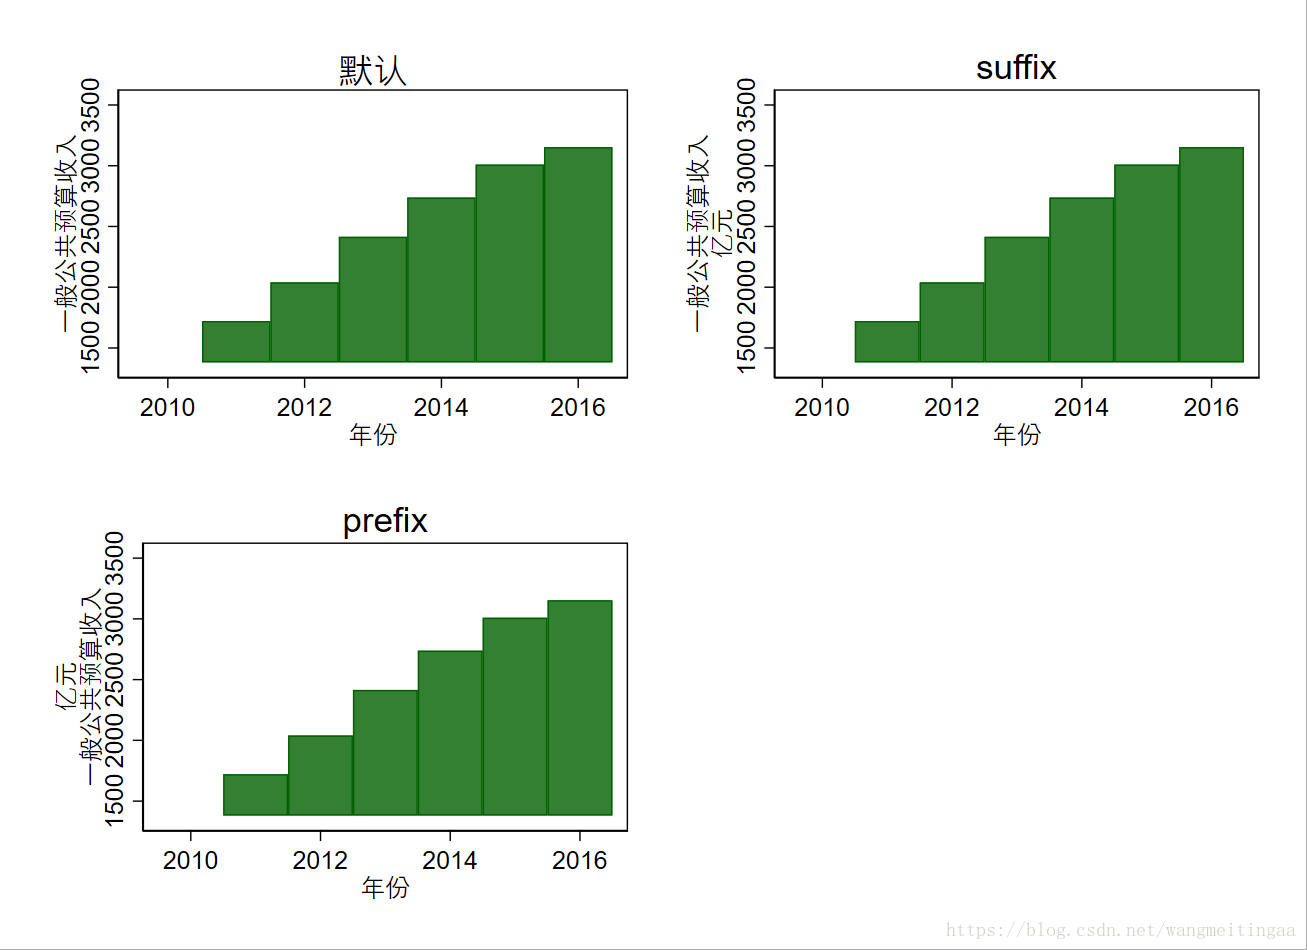
代码2
//(2)prefix和suffix
twoway bar bu_re year,title("默认")
graph save bar,replace

twoway bar bu_re year,ytitle("亿元",suffix) title("suffix")
graph save suffix,replace

twoway bar bu_re year,ytitle("亿元",prefix) title("prefix")
graph save prefix,replace

graph combine bar.gph suffix.gph prefix.gph
graph save 3,replace
做出的图如下
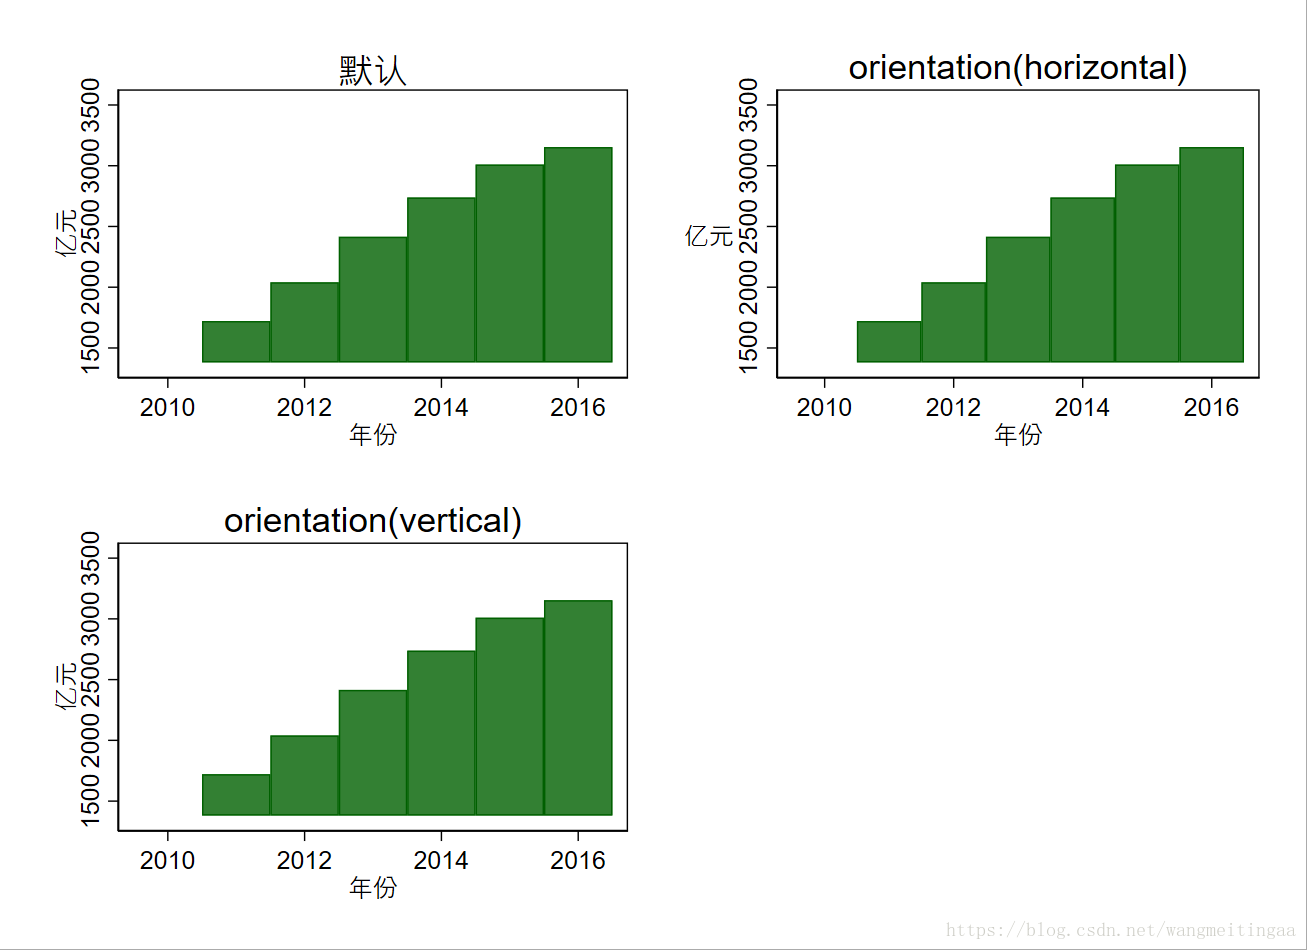
代码3
 //(3)orientation()

twoway bar bu_re year,ytitle("亿元")title("默认")
graph save bar,replace

twoway bar bu_re year,ytitle("亿元",orientation(horizontal)) title("orientation(horizontal)")
graph save oh,replace

twoway bar bu_re year,ytitle("亿元",orientation(vertical)) title("orientation(vertical)")
graph save ov,replace

graph combine bar.gph oh.gph ov.gph
做出的图如下
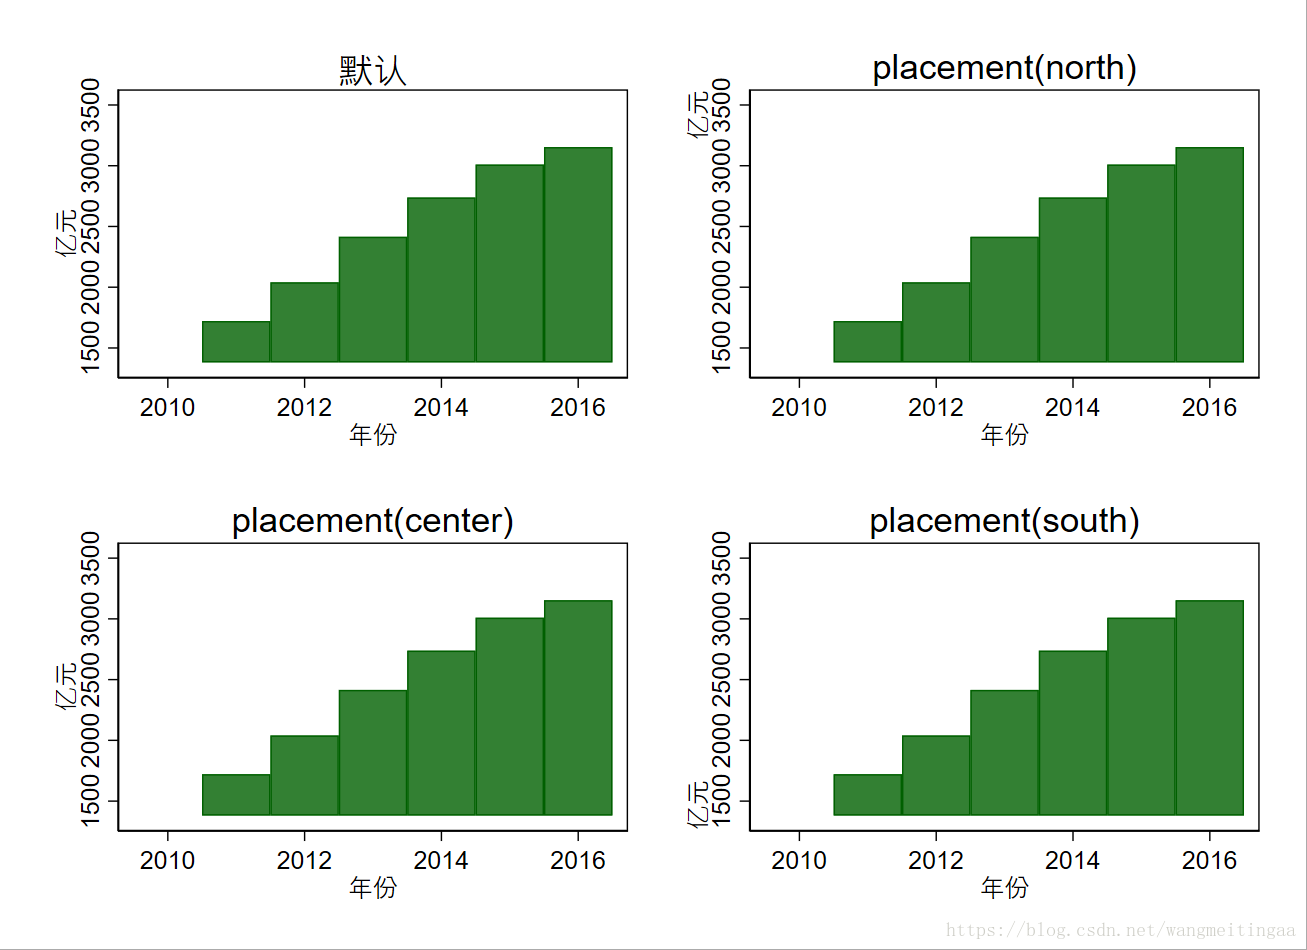
代码4
  //(4)placement()
twoway bar bu_re year,ytitle("亿元")title("默认")
graph save bar,replace

twoway bar bu_re year,ytitle("亿元",placement(north)) title("placement(north)")
graph save pn,replace

twoway bar bu_re year,ytitle("亿元",placement(center)) title("placement(center)")
graph save pc,replace

twoway bar bu_re year,ytitle("亿元",placement(south)) title("placement(south)")
graph save ps,replace

graph combine bar.gph pn.gph pc.gph ps.gph
做出的图如下
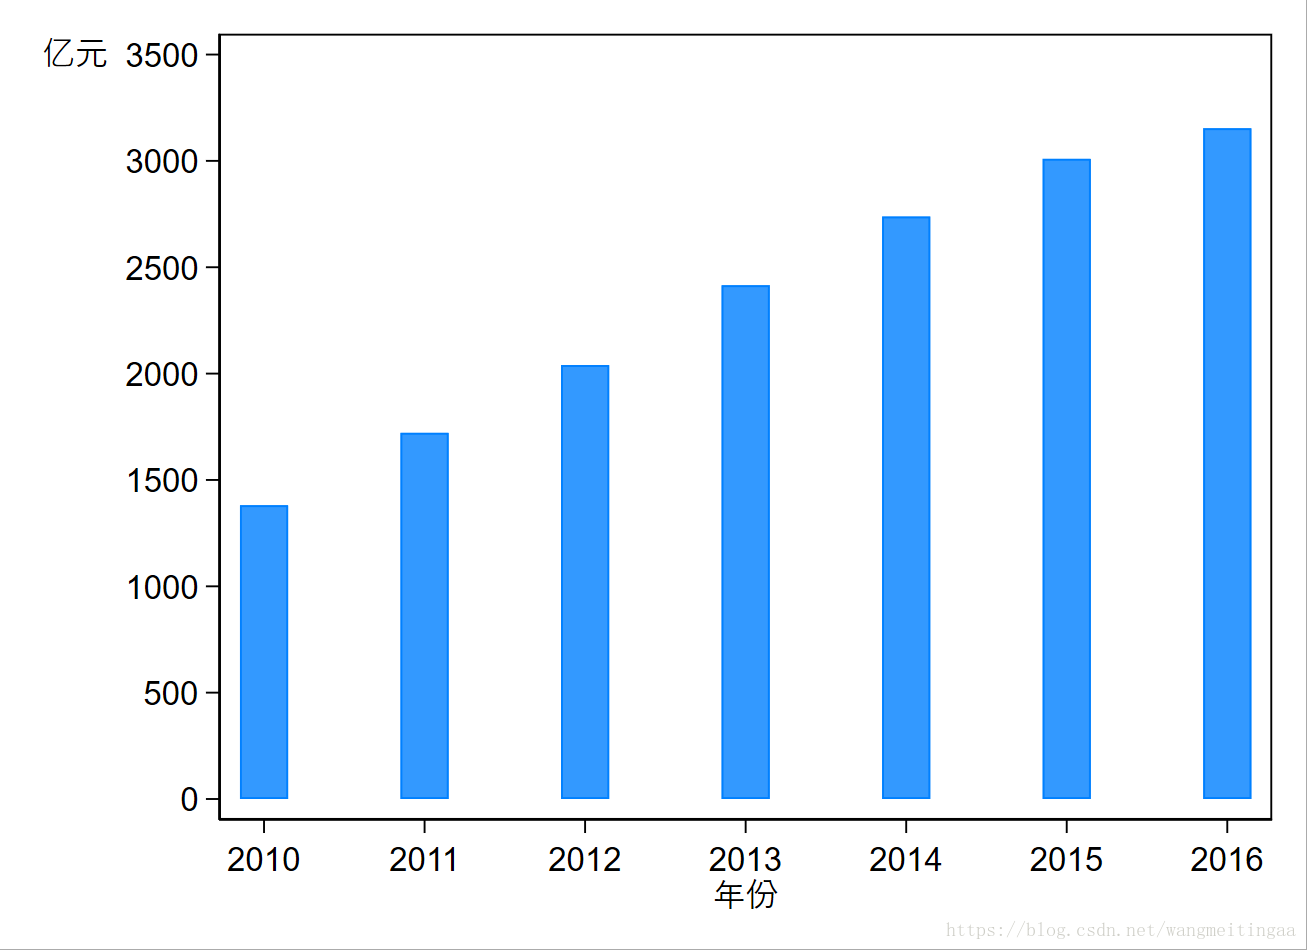
代码5
 //做出我们想要的柱状图
twoway bar bu_re year,color(midblue)  barwidth(0.3)       ///
 ylabel(0(500)3500,angle(horizontal)) xlabel(2010(1)2016) ///
 ytitle("亿元", orientation(horizontal) placement(north))
做出的图如下
新浪微博
可关注我的新浪微博,里边动不动会发一些Stata,Latex,Matlab的小东东哦。当然,本人时不时会背一些英语单词,请不要感到烦躁。