记录下来,以备之需,实例代码如下:
//初始化参数或者方法
app.initTime = 6*1000;//设置更新一次数据的间隔时间ms
app.initTimeNum = 100;//设置展示时间段数据个数
app.clickSaveData = {};//点击分析图的数据存储对象
var legendData = ['表读取','字段选择','值映射','值映射1','值映射2','值映射3','值映射4','值映射5','值映射6','值映射7','值映射8','值映射9','值映射10','值映射11'];
app.getRouteLegend = function(legen,type){//获取性能分析维度,每6个换行
var res = [];
if(type == 'clickDetail'){
res.push('总量');
}
for(var i=0;i<legen.length;i++){
res.push(legen[i]);
if(type != 'clickDetail' && (i+1)%6 === 0){//用于换行,避免过多覆盖标题(6个元素为一行)
res.push("");
}
}
return res;
};
app.getRouteData = function(id){//获取性能分析各个维度的数据量
var res = [];
if(id){
var len = 0;
while (len < app.initTimeNum) {
res.push(Math.round(Math.random() * 100));
len++;
}
}
return res;
};
app.getRouteTime = function(){//获取性能分析各个维度的时间点
var now = new Date();
var res = [];
var len = 0;
while (len < app.initTimeNum) {
res.unshift(getNowDate(now));
now = new Date(now - app.initTime);
len++;
}
return res;
};
//将当前时间转为 yyyy-mm-dd hh:mm:ss
function getNowDate(date){
var ye = date.getFullYear();
var me = date.getMonth()+1;
var de = date.getDate();
var hour = date.getHours() < 10 ? "0" + date.getHours() : date.getHours();
var minute = date.getMinutes() < 10 ? "0" + date.getMinutes() : date.getMinutes();
var second = date.getSeconds() < 10 ? "0" + date.getSeconds() : date.getSeconds();
if (me < 10) {me = "0" + me;}
if (de < 10) {de = "0" + de;}
return ye+'-'+me+'-'+de+' \n '+hour+':'+minute+':'+second;
}
//echarts配置
option = {
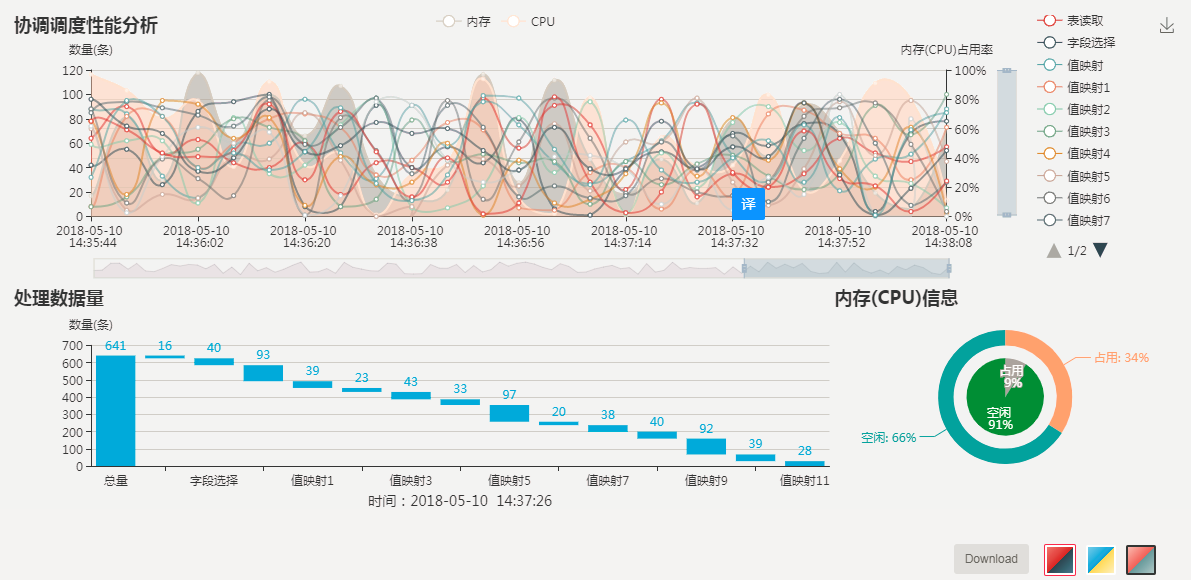
title:[{
text: '协调调度性能分析',
subtext: '',
x:'left'
},{
text: '处理数据量',
subtext: '',
x:'left',
y:'53%'
},{
text: '内存(CPU)信息',
subtext: '',
x:'70%',
y:'53%'
}],
tooltip: {
trigger: 'axis',
axisPointer: {
animation: false,
type: 'cross',
label: {
backgroundColor: '#283b56'
}
},
position: function (pos, params, dom, rect, size) {
if(params && params instanceof Array && params.length > 8){
// 鼠标在左侧时 tooltip 显示到右侧,鼠标在右侧时 tooltip 显示到左侧。
//var obj = {top: 60};
//obj[['left', 'right'][+(pos[0] < size.viewSize[0] / 2)]] = 5;
return [pos[0]+30,60];
}
},
formatter:function(params){
var html = '';
if(params && params.length>0){
app.clickSaveData['xAxisData']=[];//处理数据量x轴数据值
app.clickSaveData['seriesData']=[];//处理数据量y轴数据值
app.clickSaveData['seriesDataTotal']=0;//处理数据量总数
app.clickSaveData['cacheData'] = 0;//内存占用
app.clickSaveData['cpuData'] = 0;//cpu占用
app.clickSaveData['timeData'] = '';//处理数据量的时间
var nameTip = '', routeTip = [], cacheTip = '', cpuTip = '', detailTip = '';
for(var i=0;i<params.length;i++){
nameTip = params[i].name;
if(params[i].axisIndex===0 && params[i].seriesName!='内存' && params[i].seriesName!='CPU'){
app.clickSaveData['xAxisData'].push(params[i].seriesName);
app.clickSaveData['seriesData'].push(params[i].value);
app.clickSaveData['seriesDataTotal'] += params[i].value;
routeTip.push(params[i].seriesName+': '+params[i].data+' 条<br/>');
}else if(params[i].axisIndex===0 && params[i].seriesName=='内存'){
app.clickSaveData['cacheData']=params[i].value;
cacheTip += params[i].seriesName+': '+params[i].data+'%<br/>';
}else if(params[i].axisIndex===0 && params[i].seriesName=='CPU'){
app.clickSaveData['cpuData']=params[i].value;
cpuTip += params[i].seriesName+': '+params[i].data+'%<br/>';
}else if(params[i].axisIndex===1 && params[i].seriesName=='处理数据量'){
detailTip += params[i].name+'<br/>'+params[i].seriesName+': '+params[i].data+' 条<br/>';
}
}
if(routeTip && routeTip.length > 0){
app.clickSaveData['timeData'] = nameTip;
html = nameTip + '<br/>性能信息:<br/>' + cacheTip + cpuTip + '处理数据量:<br/>' + routeTip.join('');
}else if(detailTip){
html = detailTip;
}
}
return html;
}
},
legend: [{
x: '36%',
data:['内存','CPU']
},{
type: 'scroll',
orient: 'vertical',
right: '5%',
top: 0,
bottom: '51%',
data:(app.getRouteLegend)(legendData)
}],
toolbox: {
show: true,
feature: {
saveAsImage: {title:'保存'}
}
},
dataZoom: [{
show: true,
height:20,
bottom: '48%',
start: 0,
end: 100
},{
type: 'inside'
},{
show: true,
yAxisIndex: [0,1],
filterMode: 'empty',
width: 20,
height: '28%',
showDataShadow: false,
right: '14%'
}],
grid: [{
bottom: '60%',
left: '7%',
right: '20%'
}, {
top: '65%',
left: '7%',
right: '30%'
}],
xAxis: [
{
type: 'category',
name: '',
boundaryGap: false,
data: (app.getRouteTime)()
},
{
type : 'category',
name: '',
nameGap: 28,
nameLocation: 'middle',
gridIndex: 1,
data: (app.getRouteLegend)(legendData,'clickDetail'),
nameTextStyle: {
fontSize: 14
},
//设置字体倾斜
/*axisLabel:{
interval:0,
rotate:30,
margin:10
}*/
}
],
yAxis: [
{
type: 'value',
scale: true,
name: '数量(条)',
min: 0,
boundaryGap: [0.2, 0.2],
splitLine: {show: false}
},
{
type: 'value',
scale: true,
name: '内存(CPU)占用率',
max: 100,
min: 0,
boundaryGap: [0.2, 0.2],
splitLine: {show: true},
axisLabel: {
formatter: '{value}%'
}
},{
gridIndex: 1,
type : 'value',
name : '数量(条)',
min: 0
}
],
series: [
{
id:'cacheNumber',
name:'内存',
type:'line',
smooth:true,
xAxisIndex: 0,
yAxisIndex: 1,
itemStyle:{
normal:{
opacity: 0.5,
color: '#CFCAC4'
}
},
areaStyle: {
normal: {
opacity: 0.5,
color: '#ABA39D'
}
},
data:(app.getRouteData)('cacheNumber')
},
{
id:'cpuNumber',
name:'CPU',
type:'line',
smooth:true,
xAxisIndex: 0,
yAxisIndex: 1,
itemStyle:{
normal:{
opacity: 0.5,
color: '#FEE2D4'
}
},
areaStyle: {
normal: {
opacity: 0.5,
color: '#FFD9C4'
}
},
data:(app.getRouteData)('cpuNumber')
},
{
id:'123456',
name:'表读取',
type:'line',
smooth: true,
lineStyle: {
normal: {opacity: 0.5}
},
data:(app.getRouteData)('123456')
},
{
id:'123457',
name:'字段选择',
type:'line',
smooth: true,
lineStyle: {
normal: {opacity: 0.5}
},
data:(app.getRouteData)('123457')
},
{
id:'123458',
name:'值映射',
type:'line',
smooth: true,
lineStyle: {
normal: {opacity: 0.5}
},
data:(app.getRouteData)('123458')
},
{
id:'123459',
name:'值映射1',
type:'line',
smooth: true,
lineStyle: {
normal: {opacity: 0.5}
},
data:(app.getRouteData)('123459')
},
{
id:'123450',
name:'值映射2',
type:'line',
smooth: true,
lineStyle: {
normal: {opacity: 0.5}
},
data:(app.getRouteData)('123450')
},
{
id:'1234511',
name:'值映射3',
type:'line',
smooth: true,
lineStyle: {
normal: {opacity: 0.5}
},
data:(app.getRouteData)('1234511')
},
{
id:'1234512',
name:'值映射4',
type:'line',
smooth: true,
lineStyle: {
normal: {opacity: 0.5}
},
data:(app.getRouteData)('1234512')
},
{
id:'1234513',
name:'值映射5',
type:'line',
smooth: true,
lineStyle: {
normal: {opacity: 0.5}
},
data:(app.getRouteData)('1234513')
},
{
id:'1234516',
name:'值映射6',
type:'line',
smooth: true,
lineStyle: {
normal: {opacity: 0.5}
},
data:(app.getRouteData)('1234516')
},
{
id:'1234517',
name:'值映射7',
type:'line',
smooth: true,
lineStyle: {
normal: {opacity: 0.5}
},
data:(app.getRouteData)('1234517')
},
{
id:'1234518',
name:'值映射8',
type:'line',
smooth: true,
lineStyle: {
normal: {opacity: 0.5}
},
data:(app.getRouteData)('1234518')
},
{
id:'1234519',
name:'值映射9',
type:'line',
smooth: true,
lineStyle: {
normal: {opacity: 0.5}
},
data:(app.getRouteData)('1234519')
},
{
id:'2234519',
name:'值映射10',
type:'line',
smooth: true,
lineStyle: {
normal: {opacity: 0.5}
},
data:(app.getRouteData)('2234519')
},
{
id:'2234511',
name:'值映射11',
type:'line',
smooth: true,
lineStyle: {
normal: {opacity: 0.5}
},
data:(app.getRouteData)('2234511')
},
{
name: '总量',
type: 'bar',
stack: '总量',
xAxisIndex: 1,
yAxisIndex: 2,
itemStyle: {
normal: {
barBorderColor: 'rgba(0,0,0,0)',
color: 'rgba(0,0,0,0)'
},
emphasis: {
barBorderColor: 'rgba(0,0,0,0)',
color: 'rgba(0,0,0,0)'
}
},
data: []
},
{
name:'处理数据量',
type:'bar',
stack: '总量',
xAxisIndex: 1,
yAxisIndex: 2,
label: {
normal: {
show: true,
position: 'top',
formatter: '{c}'
}
},
itemStyle:{
normal:{
color: function(params) {
return '#03A8DB';
}
}
},
/*markLine : {
symbol: ['none', 'none'],
data : [{type : 'average',name: '平均值'}],
lineStyle:{
color: '#03A8DB'
},
label: {
normal: {
show: true,
position: 'start',
formatter: function(params){
return Math.round(params.value);
}
}
},
},*/
data:[]
},
{
name: '内存信息',
type: 'pie',
center: ['85%', '75%'],
radius: [0,'15%'],
z: 100,
data:[
{
name: '占用',
value: 0,
selected: false,
itemStyle:{
color: '#A8A4A5'
},
tooltip: {
trigger: 'item',
formatter: "{a} <br/>{b}: {d}%"
},
label: {
normal: {
position: 'inner',
formatter: "{b}\n {d}%"
}
}
},{
name: '空闲',
value: 0,
itemStyle:{
color: '#208E24'
},
tooltip: {
trigger: 'item',
formatter: "{a} <br/>{b}: {d}%"
},
label: {
normal: {
position: 'inner',
formatter: "{b}\n {d}%"
}
}
}]
},
{
name: 'CPU信息',
type: 'pie',
center: ['85%', '75%'],
radius: ['20%','26%'],
z: 100,
data:[
{
name: '占用',
value: 0,
selected: false,
itemStyle:{
color: '#FFA77B'
},
tooltip: {
trigger: 'item',
formatter: "{a} <br/>{b}: {d}%"
},
label: {
normal: {
formatter: "{b}: {d}%"
}
}
},{
name: '空闲',
value: 0,
itemStyle:{
color: '#42A1A2'
},
tooltip: {
trigger: 'item',
formatter: "{a} <br/>{b}: {d}%"
},
label: {
normal: {
formatter: "{b}: {d}%"
}
}
}]
}
]
};
myChart.on('click', function (event) {
if(event.seriesName != '总量' && event.seriesName != '处理数据量'
&& event.seriesName != '内存信息' && event.seriesName != 'CPU信息'){
//追加处理数据量的总量
app.clickSaveData['seriesData'].splice(0, 0, app.clickSaveData['seriesDataTotal']);
//加载参数内容
var updateSeries, oldSeries = option.series;
var splitNumberArray = [];
for(var index=0;index<app.clickSaveData['seriesData'].length;index++){
if(index===0 || (index > 0 && splitNumberArray[index-1] === 0)){
splitNumberArray.push(app.clickSaveData['seriesDataTotal']-app.clickSaveData['seriesData'][index]);
}else{
splitNumberArray.push(splitNumberArray[index-1]-app.clickSaveData['seriesData'][index]);
}
}
//更新处理数据量数,总量数据量
updateSeries = oldSeries.filter(function (element, index, self) {
if(element.name == '处理数据量' && element.type=='bar'){
element.data = app.clickSaveData['seriesData'];
}else if(element.name == '总量' && element.type=='bar'){
element.data = splitNumberArray;
}else if(element.name == '内存信息' && element.type=='pie'){
element.data[0].value = app.clickSaveData['cacheData'];
element.data[1].value = 100 - app.clickSaveData['cacheData'];
}else if(element.name == 'CPU信息' && element.type=='pie'){
element.data[0].value = app.clickSaveData['cpuData'];
element.data[1].value = 100 - app.clickSaveData['cpuData'];
}
return true;
});
var xData = (app.getRouteLegend)(app.clickSaveData['xAxisData'],'clickDetail');
var oldXAxis = option.xAxis;
oldXAxis[1].data = xData;
oldXAxis[1].name = '时间:' + app.clickSaveData['timeData'].replace('\n','');
//执行更新操作
myChart.setOption({
xAxis: oldXAxis,
series: updateSeries
});
}
});
setInterval(function (){
//更新处理数据量数,总量数据量
var updateSeries, oldSeries = option.series;
updateSeries = oldSeries.filter(function (element, index, self) {
if(element.type == 'line'){
if(element.data.length >= app.initTimeNum) element.data.shift();
element.data.push(Math.round(Math.random() * 100));
}
return true;
});
var oldXAxis = option.xAxis;
if(oldXAxis[0].data.length >= app.initTimeNum) oldXAxis[0].data.shift();
oldXAxis[0].data.push(getNowDate(new Date()));
//执行更新操作
myChart.setOption({
xAxis: oldXAxis,
series: updateSeries
});
}, app.initTime);