介绍
eclipse使用java连接本地mysql服务器获取数据绘制折线图。
连接数据库需要mysql-connector-java,画折线图需要jfreechart、和jcommon。(https://sourceforge.net/projects/jfreechart/files/)
除了弹窗显示折线图外,还使用ChartUtilities.saveChartAsPNG()保存到本地。
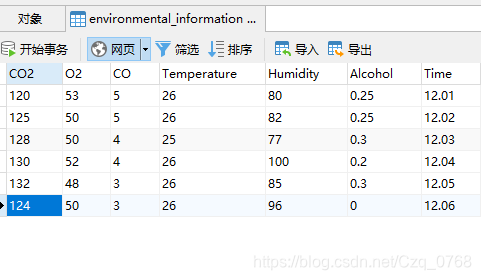
mysql表格
代码
package dsa;
import java.awt.Font;
import java.awt.GridLayout;
import java.io.File;
import java.io.IOException;
import java.sql.Connection;
import java.sql.DriverManager;
import java.sql.PreparedStatement;
import java.sql.ResultSet;
import java.sql.SQLException;
import java.text.SimpleDateFormat;
import javax.swing.JFrame;
import org.jfree.chart.ChartFactory;
import org.jfree.chart.ChartPanel;
import org.jfree.chart.ChartUtilities;
import org.jfree.chart.JFreeChart;
import org.jfree.chart.axis.DateAxis;
import org.jfree.chart.axis.ValueAxis;
import org.jfree.chart.plot.XYPlot;
import org.jfree.data.time.Day;
import org.jfree.data.time.Hour;
import org.jfree.data.time.Minute;
import org.jfree.data.time.TimeSeries;
import org.jfree.data.time.TimeSeriesCollection;
import org.jfree.data.xy.XYDataset;
public class demo_test_final {
	static String sql = "select * from environmental_information";//SQL语句    输入表名
	static ResultSet rs = null;
	public static final String url = "jdbc:mysql://localhost:3306/chatdb?serverTimezone=UTC";//输入数据库名
	public static final String user = "root";
	public static final String password = "rootroot";
	public static Connection conn = null;
	public static PreparedStatement ps = null;
	ChartPanel frame1;
	JFreeChart jfreechart;
	public static double co=0;
	public static double co2=0;
	public demo_test_final(){
		try {
    		Class.forName("com.mysql.cj.jdbc.Driver");//指定连接类型
    		conn = DriverManager.getConnection("jdbc:mysql://localhost:3306/chatdb?user=root&password=rootroot&useSSL=false&userUnicode=true&characterEncoding=GBK");//获取连接
    		ps = conn.prepareStatement(sql);//准备执行语句
    		}
    	catch (Exception e) {
    		e.printStackTrace();
    		}
		XYDataset xydataset = createDataset();
		jfreechart = ChartFactory.createTimeSeriesChart("环境浓度变化", "时间", "气体浓度",xydataset, true, true, true);
		XYPlot xyplot = (XYPlot) jfreechart.getPlot();
		DateAxis dateaxis = (DateAxis) xyplot.getDomainAxis();
        dateaxis.setDateFormatOverride(new SimpleDateFormat("hh:mm"));
        frame1=new ChartPanel(jfreechart,true);
        dateaxis.setLabelFont(new Font("黑体",Font.BOLD,14));
        dateaxis.setTickLabelFont(new Font("宋体",Font.BOLD,12));
        ValueAxis rangeAxis=xyplot.getRangeAxis();
        rangeAxis.setLabelFont(new Font("黑体",Font.BOLD,15));
        jfreechart.getLegend().setItemFont(new Font("黑体", Font.BOLD, 15));
        jfreechart.getTitle().setFont(new Font("宋体",Font.BOLD,20));
	}
	 private static XYDataset createDataset() {
		 	Day day = new Day(11, 18, 2018);
			Hour hour = new Hour(12, day);
			TimeSeries timeseries1 = new TimeSeries("CO浓度",Minute.class);
			TimeSeries timeseries2 = new TimeSeries("CO2浓度",Minute.class);
			try {
				rs = ps.executeQuery();
				double time;
				double gettime = 0;

				while (rs.next()) {
					gettime=rs.getDouble("Time");//输入要输出的元素名
					co2 = rs.getDouble("CO2");
					co=rs.getDouble("CO");
				    time=((gettime-12.0)*100);
					timeseries1.add(new Minute((int) Math.round(time), hour), co);
					timeseries2.add(new Minute((int) Math.round(time), hour), co2);
				}
				//关闭连接
				rs.close();
				conn.close();
				ps.close();
			}
			catch (SQLException e) {
				e.printStackTrace();
				}
	        TimeSeriesCollection timeseriescollection = new TimeSeriesCollection();
	        timeseriescollection.addSeries(timeseries2);
	        timeseriescollection.addSeries(timeseries1);
	        return timeseriescollection;
	    }
	  public ChartPanel getChartPanel(){
	    	return frame1;
	    }

	  public void getChart() {
		    JFrame frame=new JFrame("Java数据统计图");
			frame.setLayout(new GridLayout(2,2,10,10));
			frame.add(new demo_test_final().getChartPanel());    //添加折线图
			frame.setBounds(50, 50, 700, 500);
			frame.setVisible(true);
			File file = new File("d:\\a.png");
			try {
                ChartUtilities.saveChartAsPNG(file, jfreechart, 700, 500);
               } catch (IOException e) {
                  e.printStackTrace();
             }
	  }
	  public static void main(String args[]){
		    demo_test_final testf=new demo_test_final();
			testf.getChart();
		}
}
结果
