在使用多线激光的时候需要总是会碰到点云数据,这里简单的接受一下点云数据,并堆数据结构进行分析,方便自己后期对点云特征数据进行处理。
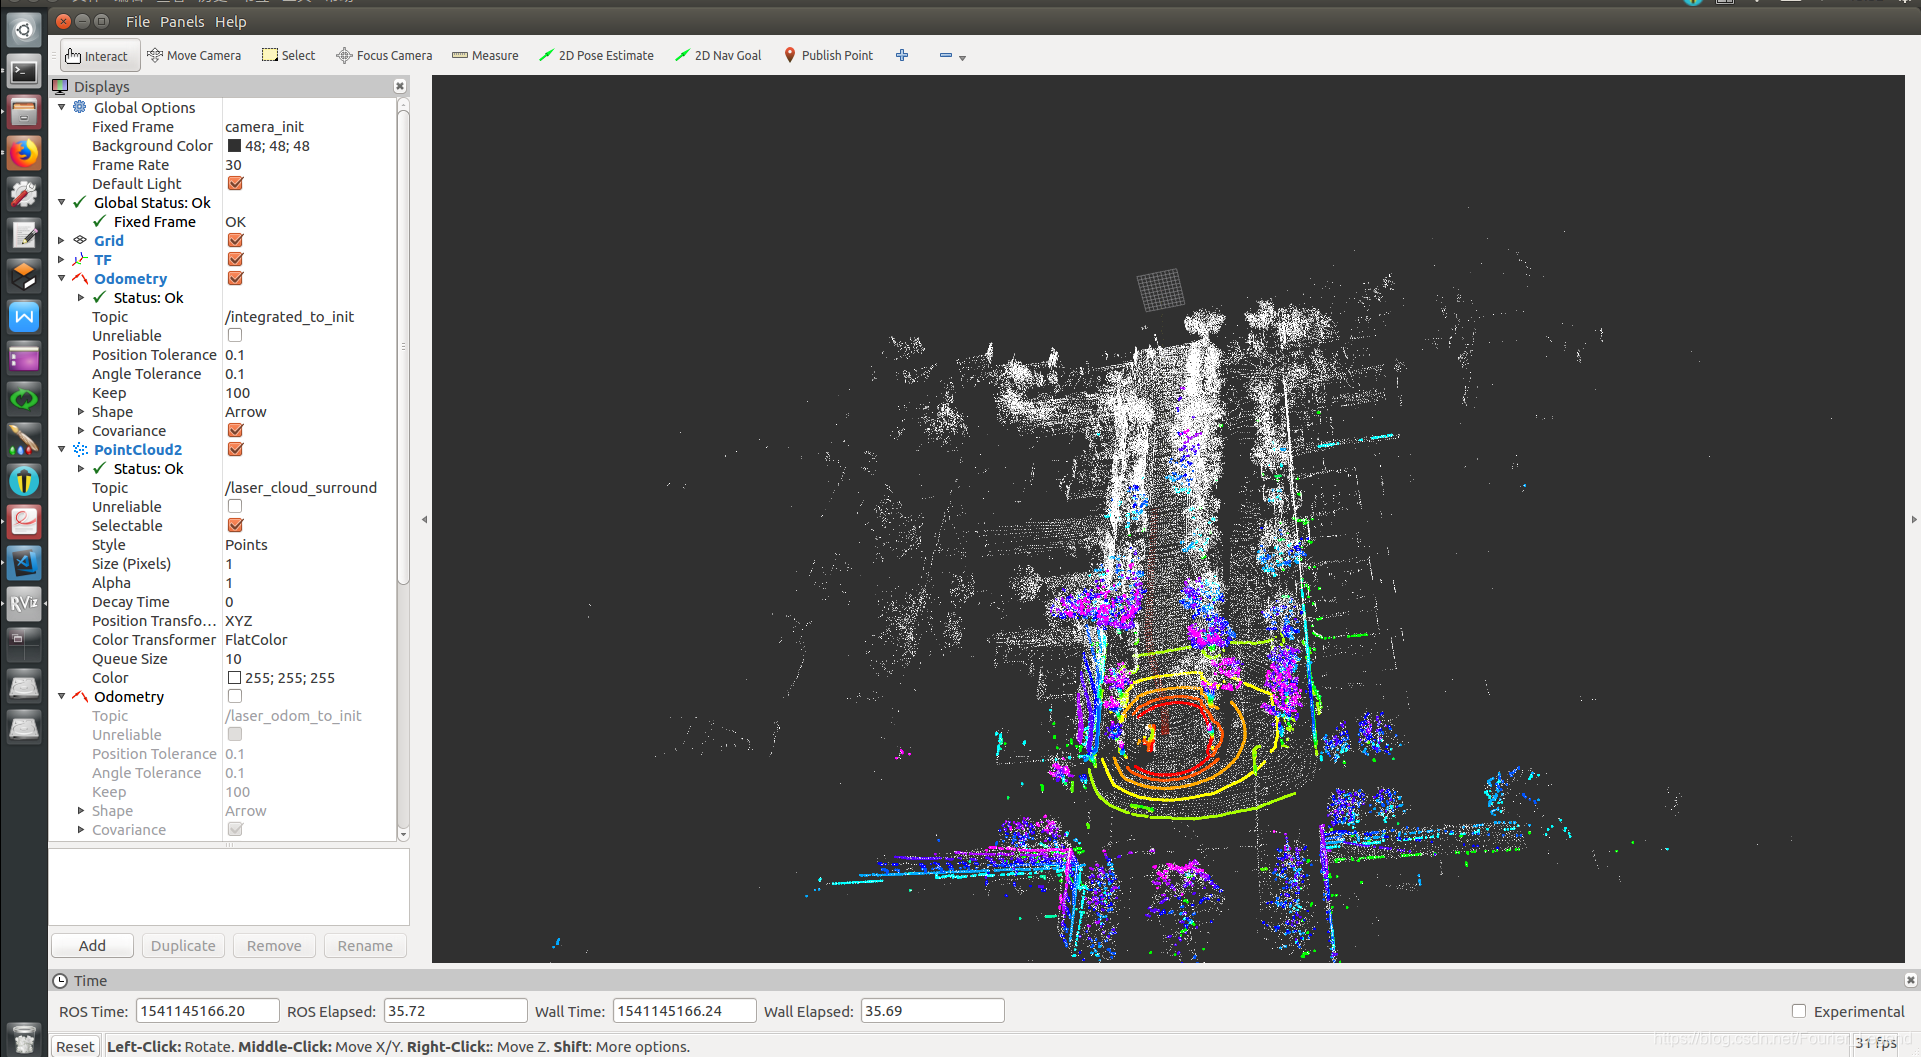
Rviz中的点云数据
本书据采用的经典的 loam_velodyne 算法,跑得是开源的包pcap 包, 有时间会详细介绍跑包的方法
点云数据结构分析
具体官方数据分析: http://docs.ros.org/jade/api/sensor_msgs/html/msg/PointCloud2.html
header: // 点云的头信息
seq: 963 //
stamp: // 时间戳
secs: 1541143772
nsecs: 912011000
frame_id: "/camera_init"
height: 1 // If the cloud is unordered, height is 1 如果cloud 是无序的 height 是 1
width: 852578 //点云的长度
fields: // sensor_msgs/PointField[] fields
-
name: "x"
offset: 0
datatype: 7 // uint8 INT8 = 1
// uint8 UINT8 = 2
// uint8 INT16 = 3
// uint8 UINT16 = 4
// uint8 INT32 = 5
// uint8 UINT32 = 6
// uint8 FLOAT32 = 7
// uint8 FLOAT64 = 8
count: 1
-
name: "y"
offset: 4
datatype: 7
count: 1
-
name: "z"
offset: 8
datatype: 7
count: 1
-
name: "intensity"
offset: 16
datatype: 7
count: 1
is_bigendian: False
point_step: 32 // Length of a point in bytes 一个点占的比特数
row_step: 27282496 // Length of a row in bytes 一行的长度占用的比特数
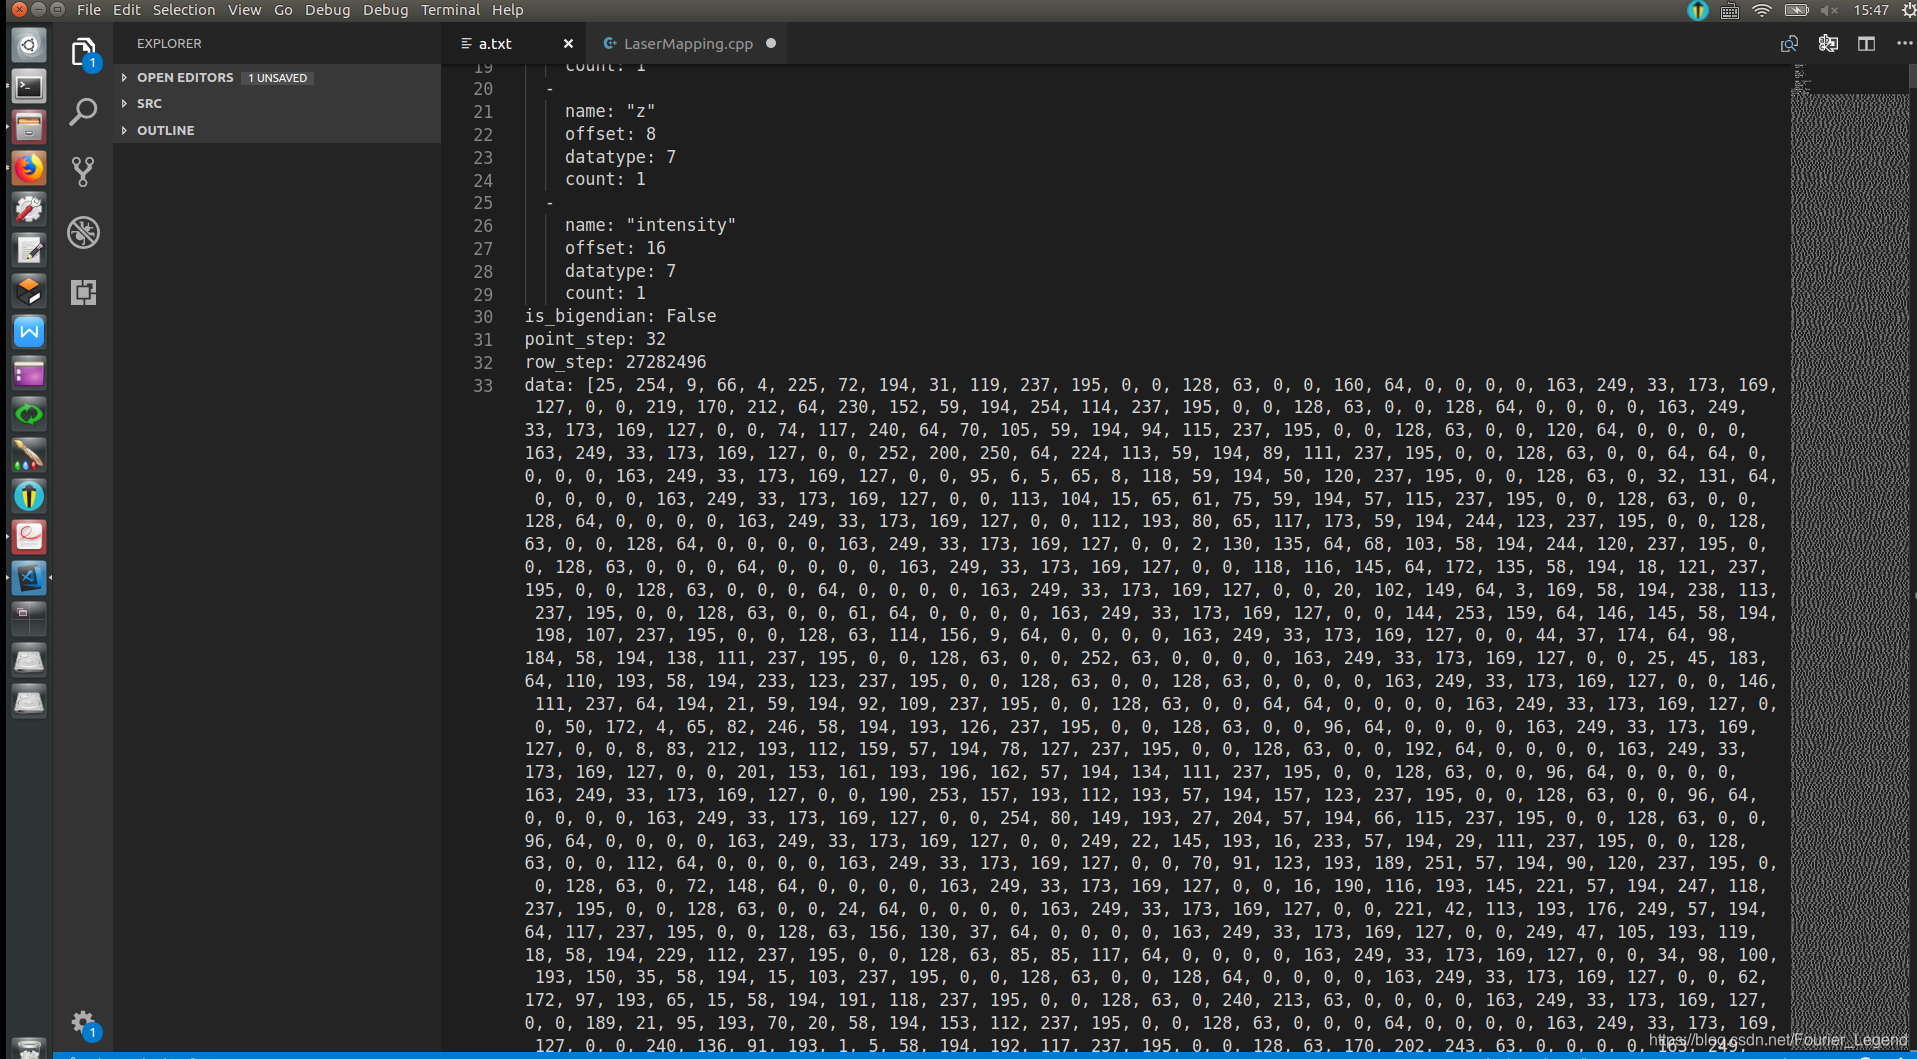
data: [ .......................................................... ] // Actual point data, size is (row_step*height)
is_dense: True // 没有非法数据点
!!! data 内部包含的是 包含点云的二进制数据流! 必须要单独解析,直接读取没有任何意义, 参考这个回答 https://answers.ros.org/question/273182/trying-to-understand-pointcloud2-msg/
点云数据 python 解析
from sensor_msgs.msg import PointCloud2
from sensor_msgs import point_cloud2

def callback_pointcloud(data):
    assert isinstance(data, PointCloud2)
    gen = point_cloud2.read_points(data)
    print type(gen)
    for p in gen:
      print p
数据截图
(看那黑丫丫的一片数据,感觉我的cpu带不动啊```)