Aspose.Words无需Microsoft Word也可在任何平台上满足Word文档的一切操作需求。本文将与大家分享如何插入散点图、面积图和气泡图到文档中。
【下载Aspose.Words for .NET最新试用版】
Aspose.Words提供了 InsertChart 方法,该方法已添加到 DocumentBuilder 类中。那么,让我们看看如何使用 DocumentBuilder-> InsertChart 方法将简单的图表插入到文档中:
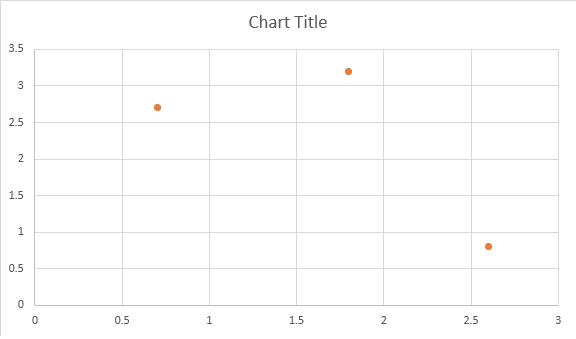
如何插入散点图
下面的示例显示了如何插入散点图。
// The path to the documents directory.
System::String dataDir = GetDataDir_WorkingWithCharts();
System::SharedPtr doc = System::MakeObject();
System::SharedPtr builder = System::MakeObject(doc);

// Insert Scatter chart.
System::SharedPtr shape = builder->InsertChart(ChartType::Scatter, 432, 252);
System::SharedPtr chart = shape->get_Chart();

// Use this overload to add series to any type of Scatter charts.
chart->get_Series()->Add(u"AW Series 1", System::MakeArray({0.7, 1.8, 2.6}), System::MakeArray({2.7, 3.2, 0.8}));

System::String outputPath = dataDir + GetOutputFilePath(u"InsertScatterChart.docx");
doc->Save(outputPath);
该代码产生以下结果:
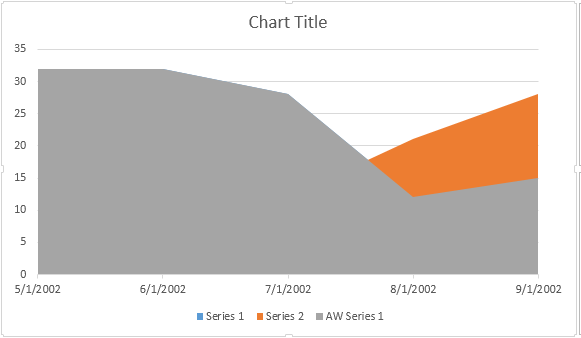
如何插入面积图。
下面的示例显示了如何插入散点图。
// The path to the documents directory.
System::String dataDir = GetDataDir_WorkingWithCharts();
System::SharedPtr doc = System::MakeObject();
System::SharedPtr builder = System::MakeObject(doc);

// Insert Area chart.
System::SharedPtr shape = builder->InsertChart(ChartType::Area, 432, 252);
System::SharedPtr chart = shape->get_Chart();

// Use this overload to add series to any type of Area, Radar and Stock charts.
chart->get_Series()->Add(u"AW Series 1",
                         System::MakeArray({System::DateTime(2002, 5, 1), System::DateTime(2002, 6, 1), System::DateTime(2002, 7, 1), System::DateTime(2002, 8, 1), System::DateTime(2002, 9, 1)}),
                         System::MakeArray({32, 32, 28, 12, 15}));
System::String outputPath = dataDir + GetOutputFilePath(u"InsertAreaChart.docx");
doc->Save(outputPath);
该代码产生以下结果:
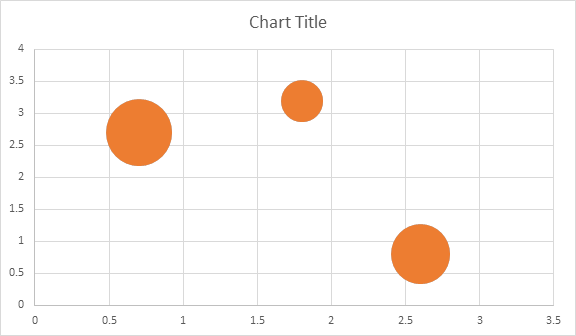
如何插入气泡图。
下面的示例显示了如何插入气泡图。
// The path to the documents directory.
System::String dataDir = GetDataDir_WorkingWithCharts();
System::SharedPtr doc = System::MakeObject();
System::SharedPtr builder = System::MakeObject(doc);

// Insert Bubble chart.
System::SharedPtr shape = builder->InsertChart(ChartType::Bubble, 432, 252);
System::SharedPtr chart = shape->get_Chart();

// Use this overload to add series to any type of Bubble charts.
chart->get_Series()->Add(u"AW Series 1",
                         System::MakeArray({0.7, 1.8, 2.6}),
                         System::MakeArray({2.7, 3.2, 0.8}),
                         System::MakeArray({10, 4, 8}));
System::String outputPath = dataDir + GetOutputFilePath(u"InsertBubbleChart.docx");
doc->Save(outputPath);
该代码产生以下结果: