设置某一块元素自己的样式
	itemStyle: {
    	color: '#F15348',
    },
如何设置图表留白
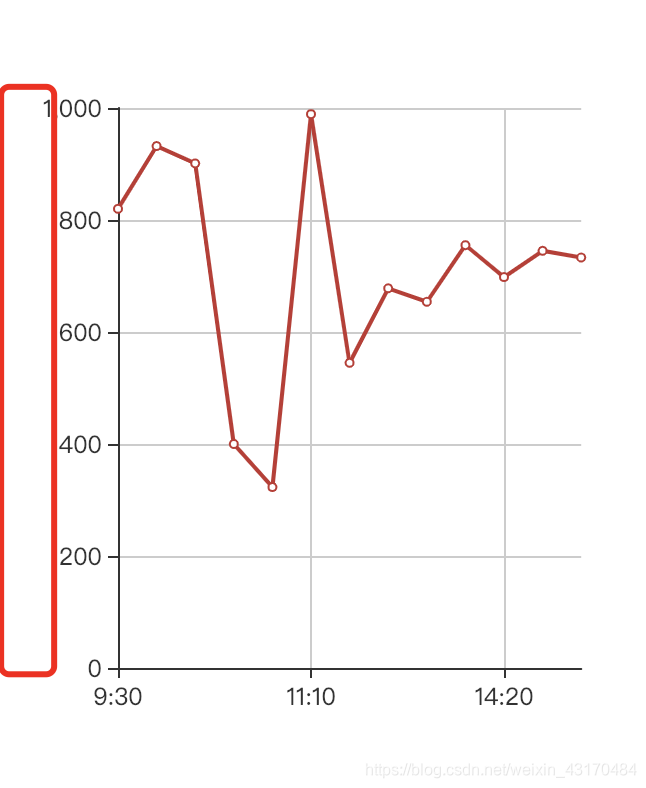
在option中加入:
	grid: {
    	x: '60px',
    	...
    }
设置横竖刻度线
在xAis和yAis中设置splitLine:
xAxis: {
                type: 'category',
                data:['9:30', '9:50', '10:10', '10:30', '10:50', '11:10', '11:30/13:00','13:20', '13:40', '14:00', '14:20', '14: 40', '15:00'],
                boundaryGap : false,
                splitLine: {
                    show: true
                }
            },
设置X轴第一个刻度贴边
在xAis中设置boundaryGap:
xAxis: {
                type: 'category',
                data:['9:30', '9:50', '10:10', '10:30', '10:50', '11:10', '11:30/13:00','13:20', '13:40', '14:00', '14:20', '14: 40', '15:00'],
                boundaryGap : false,
                splitLine: {
                    show: true
                }
            }
设置y轴标签字体颜色受数值影响
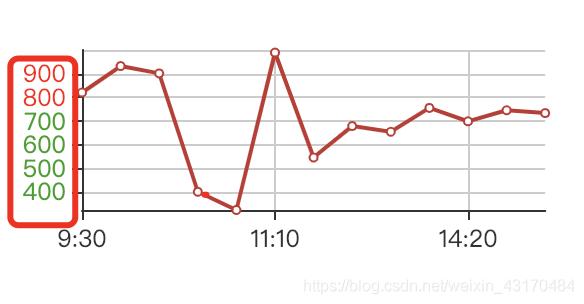
在yAxis中设置axisLabel的textStyle属性,color可以使用回调函数
yAxis: {
                type: 'value',
                splitLine: {
                    show: true
                },
                min: 'dataMin',
                axisLabel: {
                    textStyle: {
                        color: (value, index) => {
                            return value > 700 ? '#FF0A0A' : '#22A01E'
                        }
                    }
                }
            }
设置y轴步长以及相应的样式
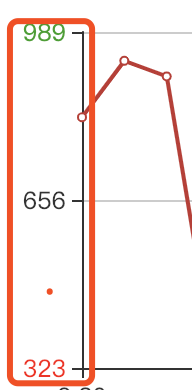
设置interval为步长的值,即可分段,在判断数值大小改变样式的时候需要先转变类型为int,在进行大小判断
yAxis: {
                type: 'value',
                splitLine: {
                    show: true
                },
                interval: 333,
                min: 'dataMin',
                max: 'dataMax',
                axisLabel: {
                    textStyle: {
                        color: (value, index) => {
                            return parseInt(value) === 656 ? '#333333' : (parseInt(value) > 656 ? '#22A01E' : '#FF0A0A')
                        }
                    },
                    align: 'right',
                },
            }
设置X轴固定显示某些值
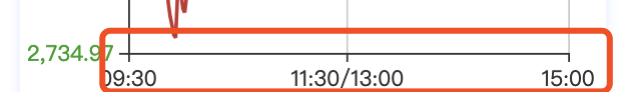
xAxis: {

                axisLabel: {
                    showMaxLabel: true,
                    interval: (index, value) => {
                        if(this.state.key === '上证综指' || this.state.key === '深圳成指'){
                            if(value==='11:30/13:00' || value==='15:00' || value==='09:30'){
                                return true
                            }
                        }
                    }
                },

            },
根据文档中对axisLabel.interval的描述,该属性可以返回一个方法,方法内部的参数是index和value,根据value是否等于想要的值,返回true/false即可控制X轴上的点显示与否