一、统计自己的好友人数,省市分布等
def b(f,lis):
    wb=openpyxl.Workbook()
    sheet=wb.active
    sheet.title='list2excel07'
    file_name=f+'.xlsx'
    for i in range(0,len(lis)):
        for j in range(0,len(lis[i])):
            sheet.cell(row=i+1,column=j+1,value=str(lis[i][j]))
    wb.save(file_name)
    print("ok")
bot=Bot(cache_path=True)
friend_all=bot.friends()
print(friend_all[0].raw)
print(len(friend_all))
lis=[]
list_0=['nickname','sex','city','province','signature','headImgUrl','headImgFlag']
lis.append(list_0)
for a in friend_all:
    NickName=a.raw.get('NickName',None)
    Sex ={1:"男",2:"女",0:"其它"}.get(a.raw.get('Sex',None),None)
    City = a.raw.get('City',None)
    Province = a.raw.get('Province',None)
    Signature = a.raw.get('Signature',None)
    HeadImgUrl = a.raw.get('HeadImgUrl',None)
    HeadImgFlag = a.raw.get('HeadImgFlag',None)
    list_0=[NickName,Sex,City,Province,Signature,HeadImgUrl,HeadImgFlag]
    lis.append(list_0)
b('xlsx',lis)
data = friend_all.stats_text(total=True, sex=True,top_provinces=30, top_cities=20)
print(data)
结果图为:

用wordcloud库将他们转成图:
def c(a):
    from wordcloud import WordCloud
    df = read_excel(a,sheetname='list2excel07')
    word_list= df['city'].fillna('0').tolist()
    new_text= ' '.join(word_list)
    wordcloud = WordCloud(font_path='simhei.ttf', background_color="pink").generate(new_text)
    plt.imshow(wordcloud)
    plt.axis("off")
    plt.show()
结果图为:

用pyecharts的则为:

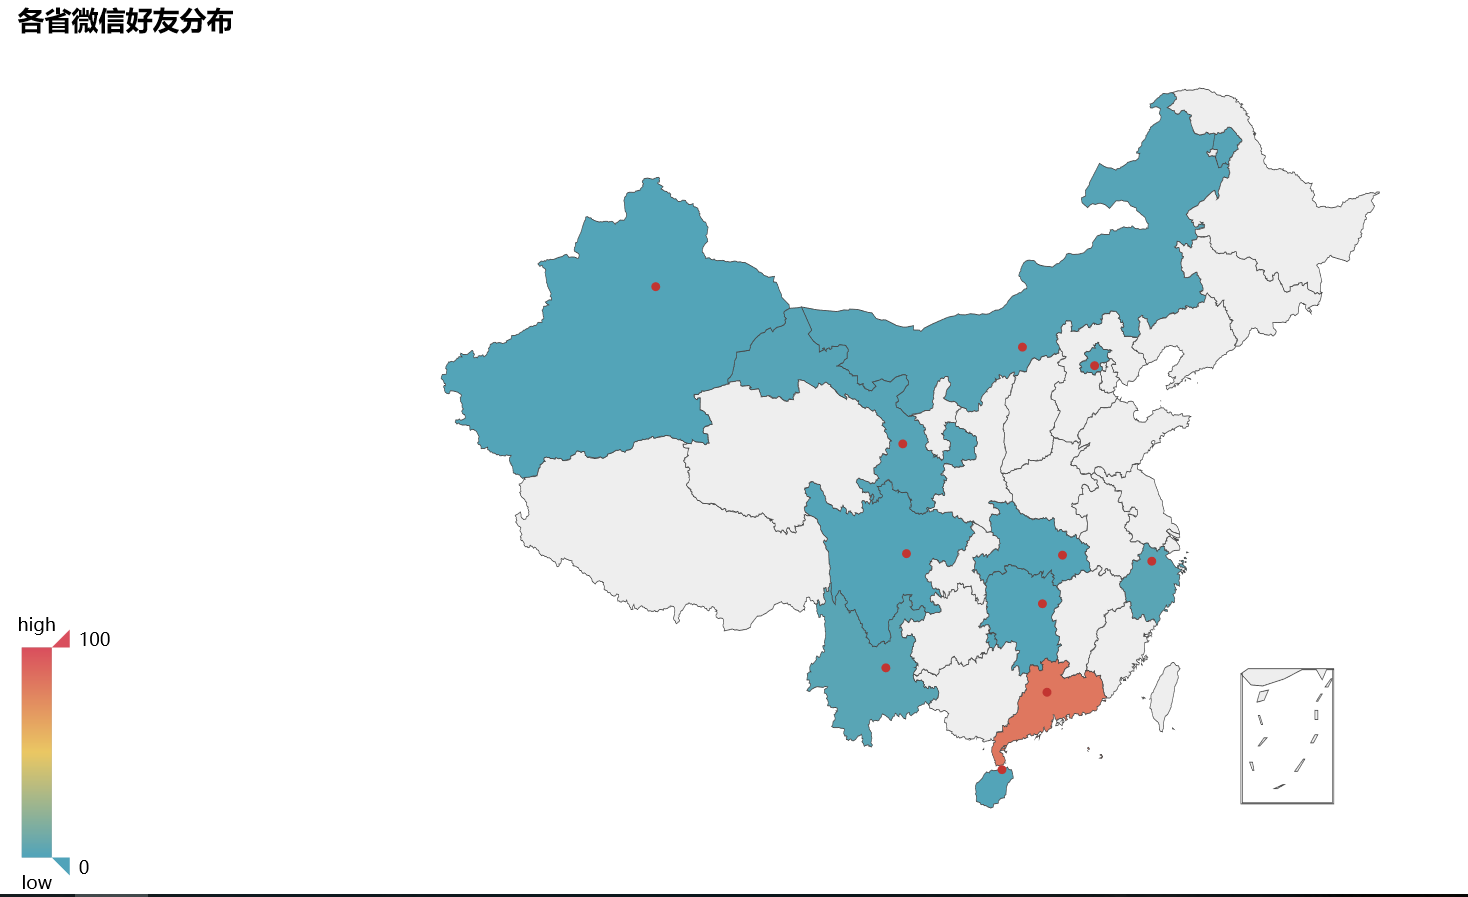
在中国的分布图为:
def e(a):
    from pyecharts import Map
    df = read_excel(a,sheetname='list2excel07')
    province_list = df['province'].fillna('NAN').tolist()
    count_province = pd.value_counts(province_list)
    value =count_province.tolist()
    attr =count_province.index.tolist()
    map=Map("各省微信好友分布", width=1200, height=600)
    map.add("", attr, value, maptype='china', is_visualmap=True, visual_text_color='#000',is_label_show = True)
    map.show_config()
    map.render(r'map1.html')
结果图: