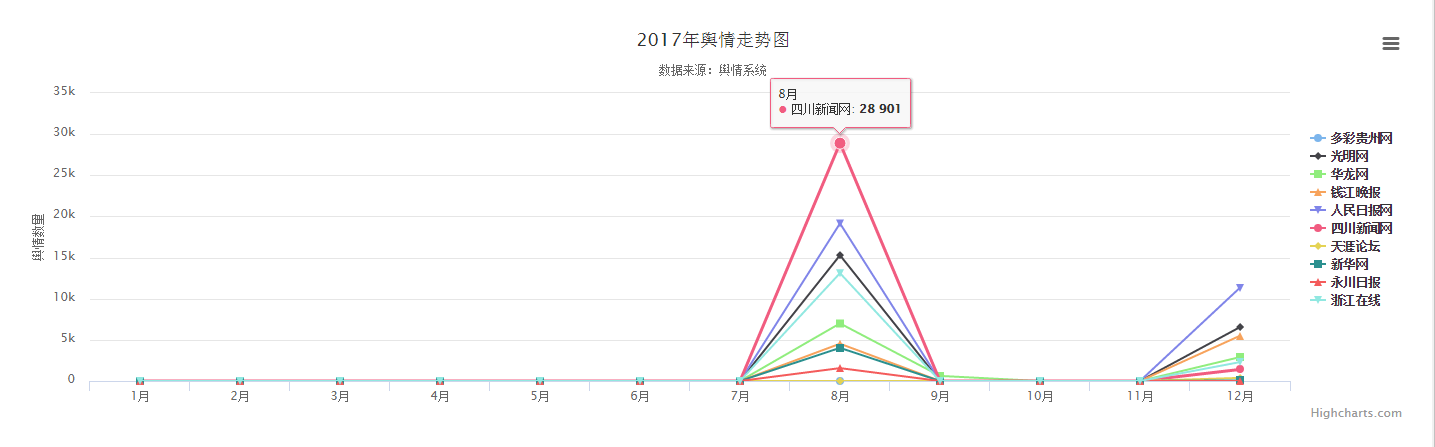
目的是展示出上一年整年每月的舆情数量,由于前面几个月确实没数据,所以看起来图表有些奇怪
最终效果如下:
数据库表结构如下:
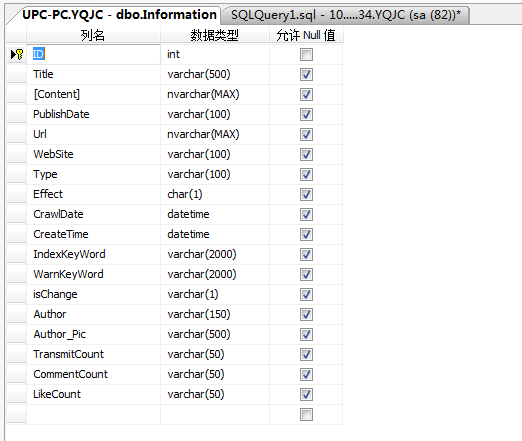
我们根据CrawlDate 爬取舆情的时间字段去处理。
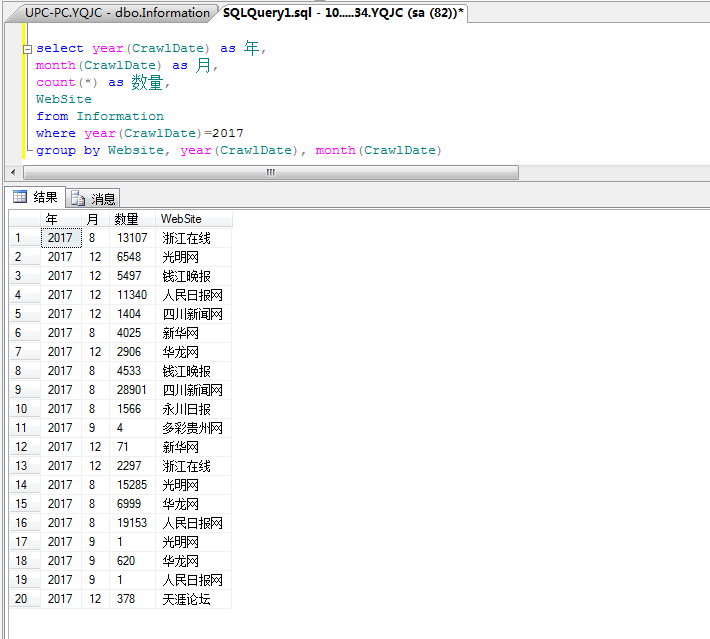
sql语句如下:
select year(CrawlDate) as 年,
month(CrawlDate) as 月,
count(*) as 数量,
WebSite
from Information
where year(CrawlDate)=2017
group by Website, year(CrawlDate), month(CrawlDate)
运行结果:
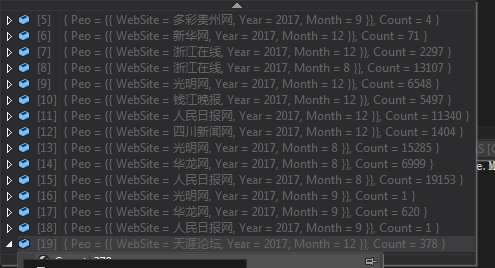
后台controller,没有使用sql语句而是另外一种:
  public class crawl
        {
            public string name;
            public int[] data;
        }
        /// <summary>
        /// 获取舆情走势
        /// </summary>
        /// <returns></returns>

        public ActionResult getCrawl()
        {
            //int  myYear = DateTime.Now.Year-1;
            using (BaseDataDbContext db = new BaseDataDbContext())
            {
                var q = db.Informations;//.Where(u=>u.CrawlDate.Year.Equals("2017"));
                var sums2 = from emp in q
                            where emp.CrawlDate.Year.Equals(DateTime.Now.Year - 1)//查询去年的数据
                            group emp by new { emp.WebSite, emp.CrawlDate.Year, emp.CrawlDate.Month } into g
                            select new { Peo = g.Key, Count = g.Count() };
                List<crawl> list = new List<crawl>();

                List<SelectListItem> s = ShiJianService.GetYqjcType();
                for (var j = 0; j < s.Count; j++)
                {
                    crawl c = new crawl();
                    c.name = s[j].Text;
                    int[] nums = new int[12] { 0,0,0,0,0,0,0,0,0,0,0,0 };
                    foreach (var item in sums2)
                    {
                        if (item.Peo.WebSite == s[j].Text)
                        {
                            nums[item.Peo.Month - 1] = item.Count;
                        }
                        else
                            continue;
                    }
                    c.data = nums;
                    list.Add(c);
                }


                string str = JsonConvert.SerializeObject(list, Formatting.Indented);
                return Content(str);

            }

        }
查询结果如图:
前台图表展示代码:
 function getCrawl() {

            $.ajax({
                type: 'GET',
                url: '/Account/Base/getCrawl',
                ajaxCache: true,
                datatype: 'json',

                success: function (datas) {
                    //console.log(datas);
                    var _obj = JSON.parse(datas);
                    //console.log(_obj);
                    // console.log(_obj);
                    var  mydate =new Date();
                    var lastyear = mydate.getFullYear() - 1;

                     var chart = Highcharts.chart('container4', {
                         title: {
                             text: lastyear+'年舆情走势图'
                         },
                         subtitle: {
                             text: '数据来源:舆情系统'
                         },
                         xAxis: {
                             categories: getMonth()
                         },
                         yAxis: {
                             title: {
                                 text: '舆情数量'
                             }
                         },
                         legend: {
                             layout: 'vertical',
                             align: 'right',
                             verticalAlign: 'middle'
                         },
                         plotOptions: {
                             series: {
                                 label: {
                                     connectorAllowed: false
                                 },
                                 //pointStart: 2010
                             }
                         },
                         series: _obj,
                         responsive: {
                             rules: [{
                                 condition: {
                                     maxWidth: 500
                                 },
                                 chartOptions: {
                                     legend: {
                                         layout: 'horizontal',
                                         align: 'center',
                                         verticalAlign: 'bottom'
                                     }
                                 }
                             }]
                         }
                     });


                },
                error: function (ret) {

                    // 此处放失败后执行的代码
                    console.log(ret);

                }
            });


        }