
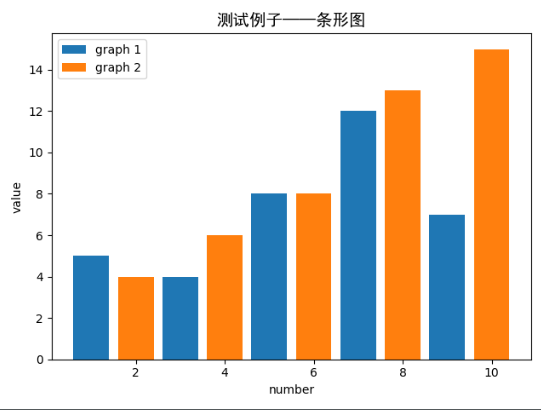
简单条形图示例:
# -*- coding: utf-8 -*-
import matplotlib.pyplot as plt
from matplotlib.font_manager import FontProperties
import seaborn as sns


font = FontProperties(fname=r"C:\Windows\Fonts\simhei.ttf", size=14)

plt.bar([1, 3, 5, 7, 9], [5, 4, 8, 12, 7], label='graph 1')

plt.bar([2, 4, 6, 8, 10], [4, 6, 8, 13, 15], label='graph 2')

# params

# x: 条形图x轴
# y:条形图的高度
# width:条形图的宽度 默认是0.8
# bottom:条形底部的y坐标值 默认是0
# align:center / edge 条形图是否以x轴坐标为中心点或者是以x轴坐标为边缘

plt.legend()

plt.xlabel('number')
plt.ylabel('value')

plt.title(u'测试例子——条形图', FontProperties=font)

plt.show()
# sns.set_style('darkgrid')
# sns.distplot(d)
效果图:
转载于:https://my.oschina.net/lyleluo/blog/3056490