datingTestSet.txt: 是一个4列的文本文件,其中前三列是features 最后一列是labels
目标: 将该文本文件分离成 x,y 其中 x 为 含有features 的 matrix y 为仅含有labels 的 list
import numpy as np
def file2matrix(filename):
        fr=open(filename)
        numberoflines=len(fr.readlines())
        y=[]
        x=np.zeros([numberoflines,3])
        index=0
        fr=open(filename)
        for lines in fr.readlines():
            data=[]
            lines=lines.strip()
            data=lines.split('\t')
            x[index,:]=data[0:3]
            index=index+1
            y.append(data[-1])

        return x,y
【结果:】
y:
'didntLike',
 'smallDoses',
 'smallDoses',
 'smallDoses',
 'largeDoses',
 'smallDoses',
 'didntLike',
 'largeDoses',
 'smallDoses',
 'largeDoses',
 'smallDoses',
 'largeDoses',
 'smallDoses',
x:
array([[  4.09200000e+04,   8.32697600e+00,   9.53952000e-01],
       [  1.44880000e+04,   7.15346900e+00,   1.67390400e+00],
       [  2.60520000e+04,   1.44187100e+00,   8.05124000e-01],
       ...,
       [  2.65750000e+04,   1.06501020e+01,   8.66627000e-01],
       [  4.81110000e+04,   9.13452800e+00,   7.28045000e-01],
       [  4.37570000e+04,   7.88260100e+00,   1.33244600e+00]])
【tips】
matrix: 只能是二维的
array: 不只是二维
【features 的类别:】
categorical features: comes from unordered sets: e.g. job city
numerical features: comes from ordered sets: e.g. age rates
将 categorical features 转成 numerical features: 用数字代替
e.g. 香蕉 苹果 梨子
1 2 3
01 10 11
001 010 100
转换:
import numpy as np
def file2matrix(filename):
        fr=open(filename)
        numberoflines=len(fr.readlines())
        y=[]
        stry=[]
        x=np.zeros([numberoflines,3])
        index=0
        fr=open(filename)
        for lines in fr.readlines():
            #data=[]
            lines=lines.strip()
            data=lines.split('\t')
            x[index,:]=data[0:3]
            index=index+1
            stry.append(data[-1])
            # turn the categorical features to numerical features:
        typeoflabels=np.unique(stry)
        count=typeoflabels.shape[0]
        for labels in stry:
            if labels==typeoflabels[0]:
                y.append(1)
            elif labels==typeoflabels[1]:
                y.append(2)
            else:
                y.append(3)
        return x,y
【结果--y】
  1,
  3,
  3,
  3,
  2,
  3,
  1,
  2,
  3,
  2,
  3,
  2,
  3,
  1,
  1,
***********************************
***********************************
***********************************
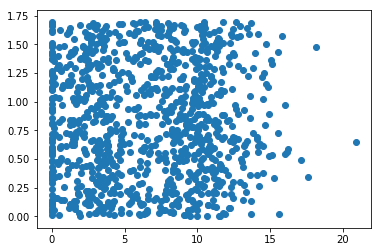
import matplotlib
import matplotlib.pyplot as plt
fig=plt.figure()
ax=fig.add_subplot(111)
ax.scatter(x[:,1],x[:,2])
plt.show()
扫描二维码关注公众号,回复:
656148 查看本文章

结果图:
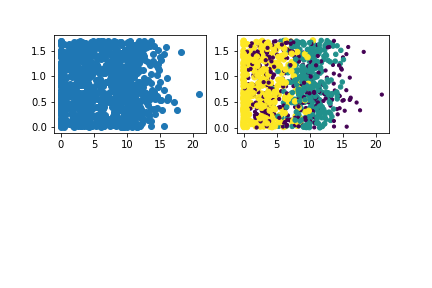
【按照labes的分类给散点图上色】
import numpy as np
import matplotlib
import matplotlib.pyplot as plt
plt.figure()
plt.subplot(221)
plt.scatter(x[:,1],x[:,2])
plt.subplot(222)
y=np.array(y)
plt.scatter(x[:,1],x[:,2],10*y,10*y)
plt.savefig("scatterimage.png")  # call savefig before call show
plt.show()
【结果图】
*********************************************************************************************************
【random forest】
import numpy as np
from sklearn.cross_validation import train_test_split
from sklearn.datasets import load_iris
from sklearn.ensemble import RandomForestClassifier
iris = load_iris()
n, d = iris.data.shape
X_train, X_test, y_train, y_test = train_test_split(iris.data, iris.target, test_size=0.3)
clf=RandomForestClassifier(n_estimators=100)
model2 =clf.fit(X_train,y_train)
y_pred = model2.predict(X_train)
train_error = np.mean(y_pred != y_train)
print("train error is %f" % train_error)
y_pred_test=model2.predict(X_test)
test_error=np.mean(y_pred_test != y_test)
print("test error is %f" % test_error)
【测试结果】
train error is 0.000000
test error is 0.022222