版权声明:本文为博主原创文章,未经博主允许不得转载。 https://blog.csdn.net/this_is_id/article/details/86688585
安装
pip install pyecharts初始化界面

自定义模板
其中引入了echarts.min.js
<!DOCTYPE html>
<html style="height: 100%">
<head>
    <meta charset="UTF-8">
    <title>Echarts</title>
</head>
<body style="height: 100%; margin: 0">
<div id="container" style="height: 100%"></div>
<script type="text/javascript" src="echarts.min.js"></script>
</body>
</html>
使用QWebEngineView加载本地html
loadFinished信号确保html加载完成后渲染画布
url = QUrl("file:///template.html")
self.view.load(url)
self.view.loadFinished.connect(self.set_options)
图表渲染
self.echarts确保首次加载时才初始化echarts,这里用到了runJavaScript方法,可以直接执行js代码;
self.get_options得到myChart用的options(详细说明),这里直接用pyecharts生成,见self.create_pie,其它类型图表参照此方法即可;
def set_options(self):
if not self.view:
return
if not self.echarts:
# 初始化echarts
self.view.page().runJavaScript(
'''
var myChart = echarts.init(document.getElementById('container'), 'light', {renderer: 'canvas'});
'''
)
self.echarts = True
options = self.get_options()
if not options:
return
self.view.page().runJavaScript(
f'''
var option = eval({options});
myChart.setOption(option);
'''
)
def get_options(self):
v1, v2, v3, v4, v5, v6 = self.spinbox1.value(), self.spinbox2.value(), self.spinbox3.value(), self.spinbox4.value(), \
self.spinbox5.value(), self.spinbox6.value()
v = [v1, v2, v3, v4, v5, v6]
if self.combobox_type.currentIndex() == 0:
# 饼图
options = self.create_pie(v)
elif self.combobox_type.currentIndex() == 1:
# 柱状图
options = self.create_bar(v)
elif self.combobox_type.currentIndex() == 2:
# 折线图
options = self.create_line(v)
elif self.combobox_type.currentIndex() == 3:
# 折线、柱状图
options = self.create_line_bar(v)
else:
return
return options
def create_pie(self, v):
pie = Pie(TITLE_TEXT, TITLE_SUBTEXT)
pie.add("", ATTR, v, is_label_show=True)
snippet = TRANSLATOR.translate(pie.options)
options = snippet.as_snippet()
return options主题切换
基础版本仅支持light、dark两种主题,更多主题见echarts-themes-pypkg
def change_theme(self, theme):
if not self.view:
return
options = self.get_options()
if not options:
return
self.view.page().runJavaScript(
f'''
myChart.dispose();
var myChart = echarts.init(document.getElementById('container'), '{theme}', {{renderer: 'canvas'}});
myChart.clear();
var option = eval({options});
myChart.setOption(option);
'''
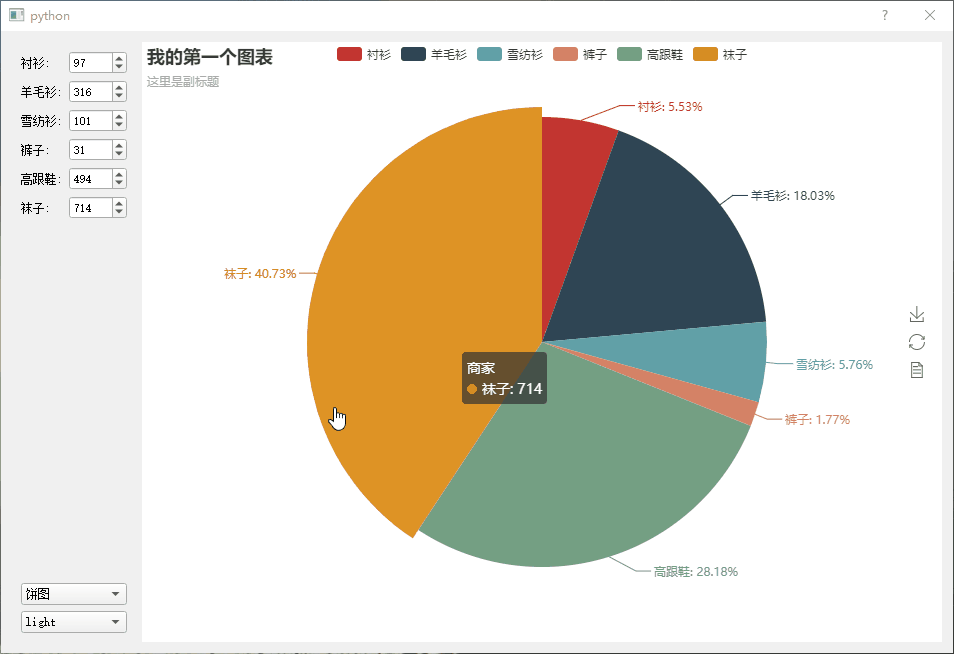
)截图
效果图如下,另附上源码下载地址:pyqt、echarts示例