1. 摘要:基于鸢尾花卉(iris)数据集来练习运用ggplot2进行数据可视化。
2. 数据来源:R语言内置数据集

3. 练习
3.1 基于原数据集以及整合数据集
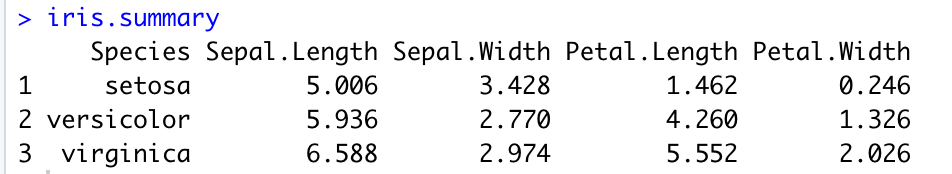
# Aggregate the first four column by Species and calculate the mean
iris.summary <- aggregate(iris[1:4], list(iris$Species), mean)

# Change the name of the first column to 'Species'
names(iris.summary)[1] <- 'Species'
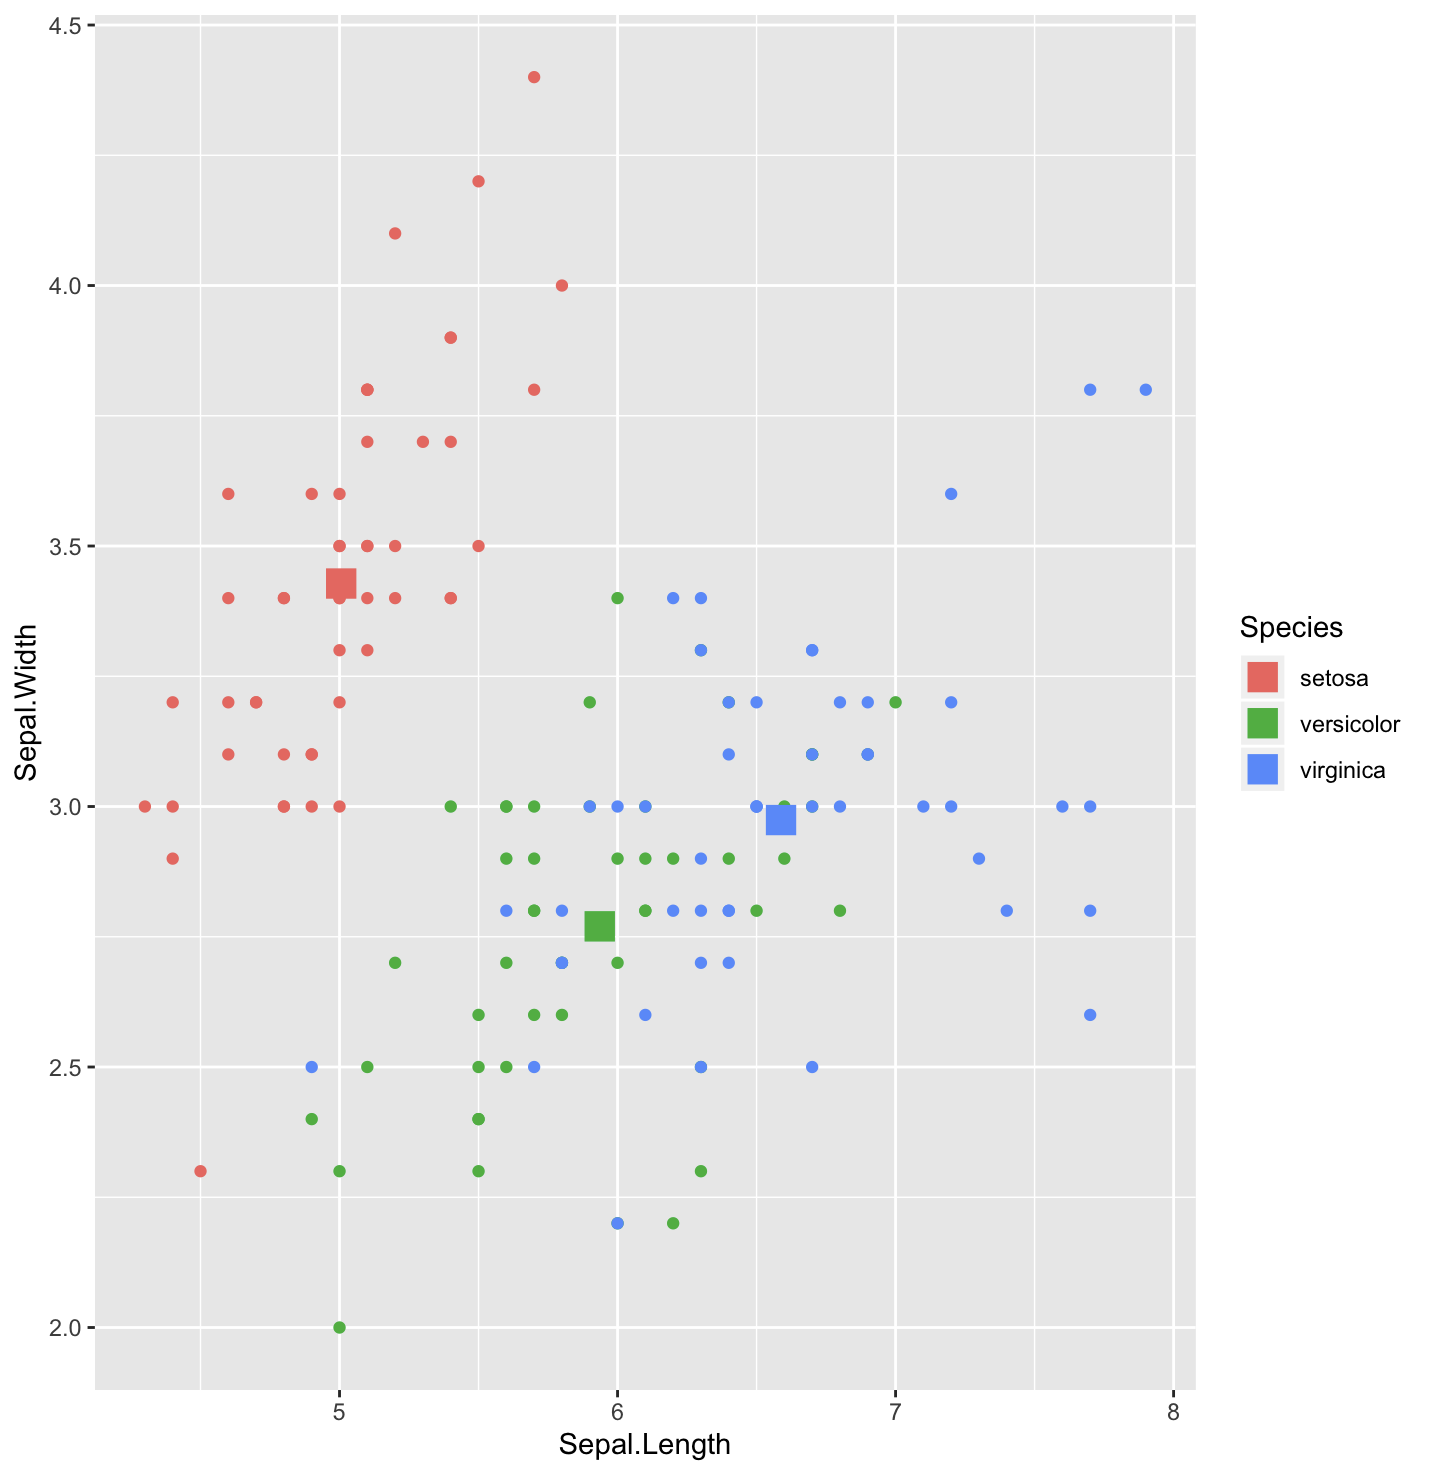
library(ggplot2) # load the ggplot2 package
ggplot(iris, aes(x = Sepal.Length, y = Sepal.Width, col = Species)) + geom_point() + geom_point(data = iris.summary, shape = 15, size = 5)
ggplot(iris, aes(x = Sepal.Length, y = Sepal.Width, col = Species)) + geom_point() +  geom_vline(
  data = iris.summary, linetype = 2, aes(xintercept = Sepal.Length, col = Species)) + geom_hline(
    data = iris.summary, linetype = 2, aes(yintercept = Sepal.Width, col = Species))

3.2 基于清洗的数据集
library(tidyr) # load tidyr package
#iris.tidy----data frome format
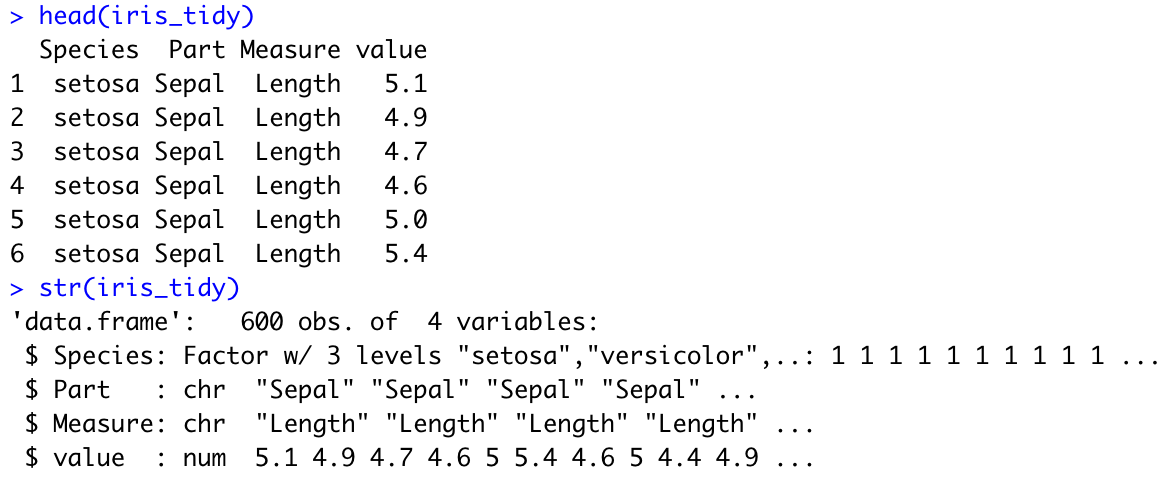
iris_tidy <- iris %>%
gather(key, value, -Species) %>%
separate(key, c('Part', 'Measure'), '\\.')
head(iris_tidy)
str(iris_tidy)
ggplot(iris_tidy, aes(x = Species, y = value, col = Part)) + geom_jitter() + facet_grid(. ~ Measure)

#iris.wide
iris_wide <- iris %>%
  gather(key, value, -Species, -id) %>%
  separate(key, c('Part', 'Measure'), '\\.') %>%
  spread(Measure, value)
head(iris_wide)
str(iris_wide)

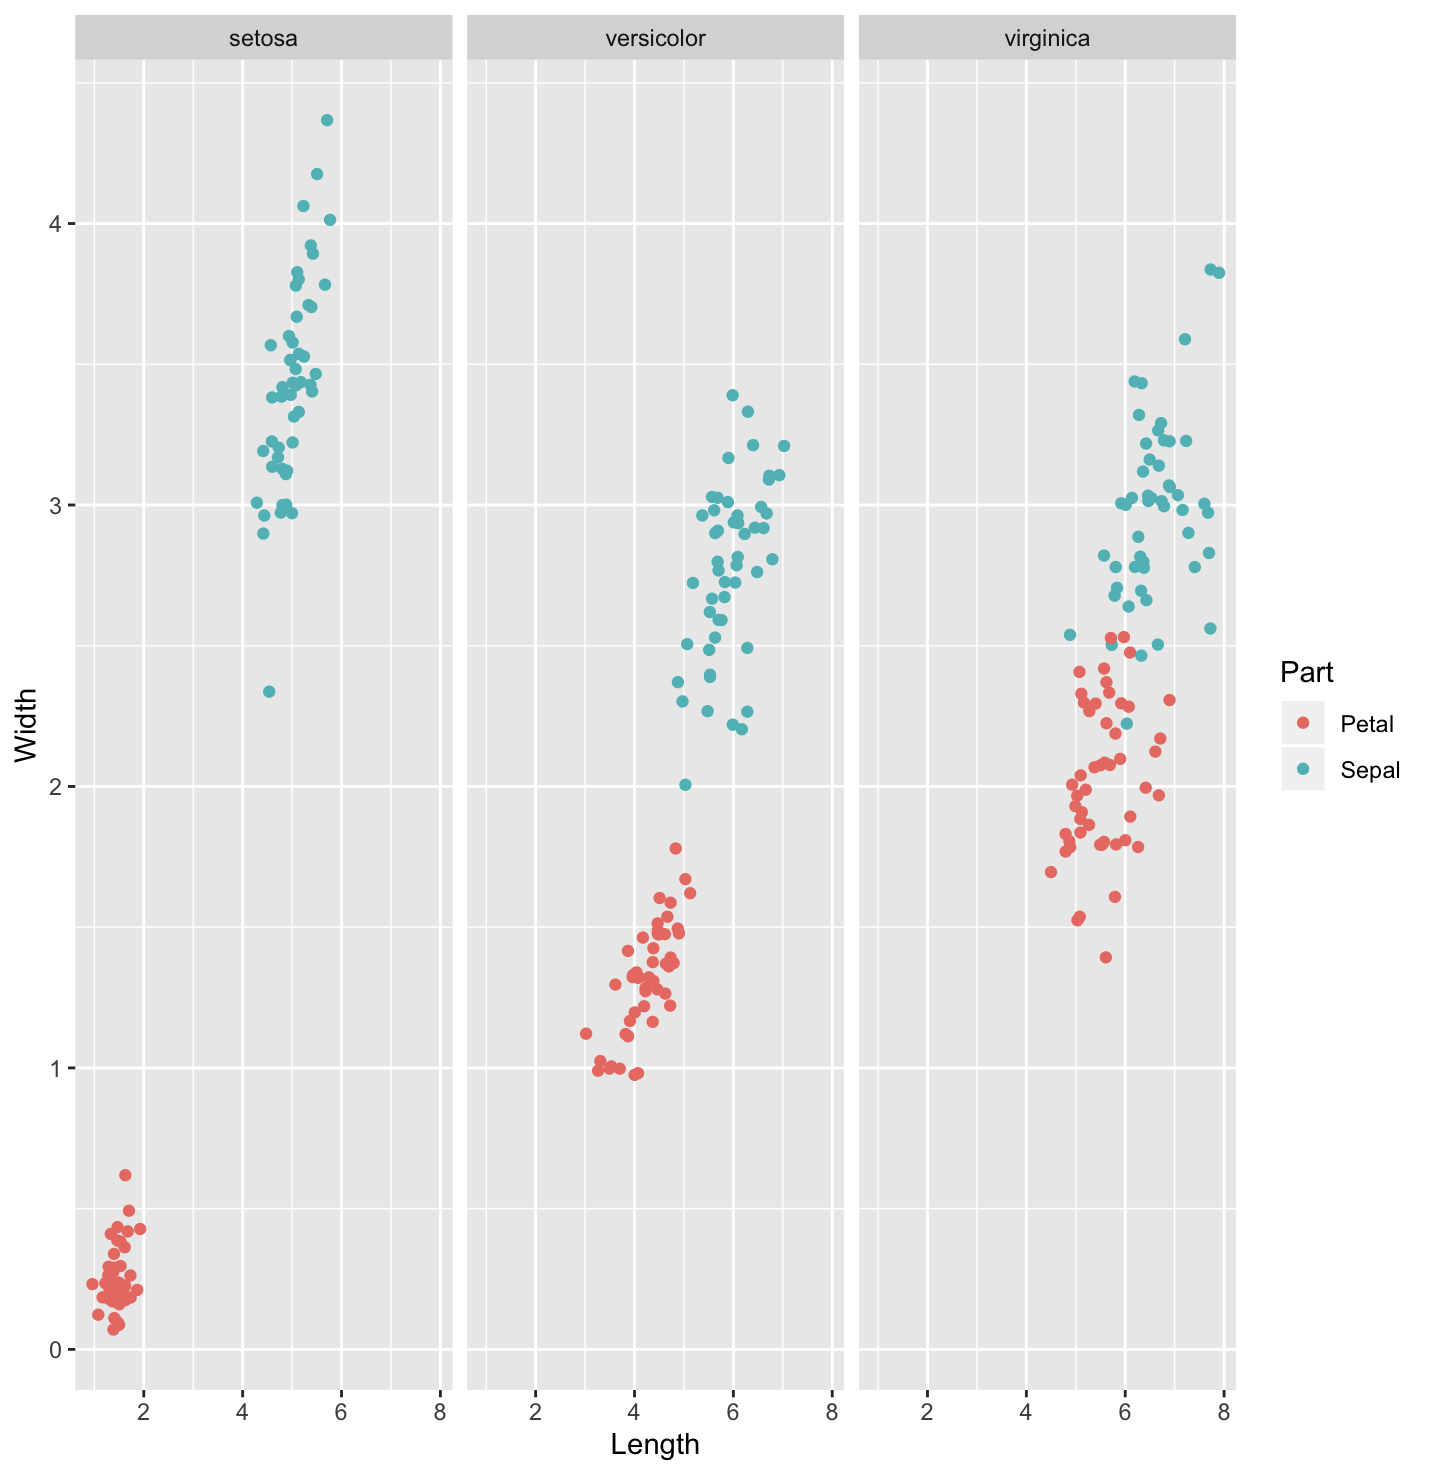
ggplot(iris_wide, aes(x = Length, y = Width, color = Part)) + geom_jitter() + facet_grid(. ~ Species)