一、TensorBoard可视化工具
TensorBoard实现形式为web应用程序,这为提供分布式、跨系统的图形界面服务带来了便利。
1.使用流程
SummaryOps->Session--(input)-->FileWriter---(add)--->Event file---(load)-->TensorBoard
import tensorflow as tf

with tf.name_scope('graph') as scope:
     matrix1 = tf.constant([[3., 3.]],name ='matrix1')  #1 row by 2 column
     matrix2 = tf.constant([[2.],[2.]],name ='matrix2') # 2 row by 1 column
     product = tf.matmul(matrix1, matrix2,name='product')

sess = tf.Session()

writer = tf.summary.FileWriter("/data/logs/", sess.graph) #第一个参数指定生成文件的目录。

init = tf.global_variables_initializer()

sess.run(init)
命令行执行 tensorboard --logdir=/data/logs
打开localhost:6006
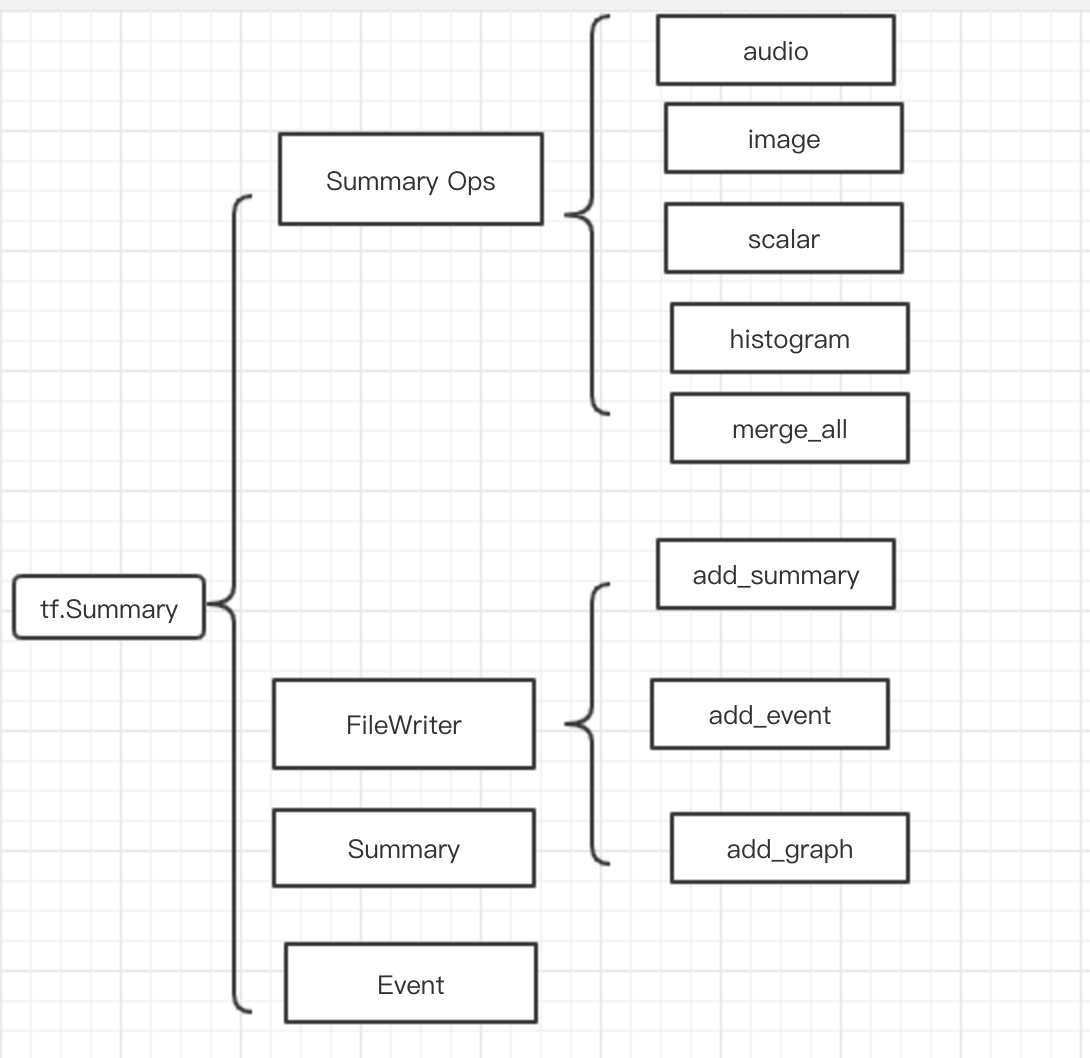
如图所示,tf.summary 模块的功能
2.可视化数据流图
通过with tf.name_scope('sc_name'):定义一个名字可以把一些列操作定义为一个节点,在图上展示为一个节点

点击加号可以展示节点内详情
from __future__ import absolute_import
from __future__ import division
from __future__ import print_function

import tensorflow as tf

from tensorflow.examples.tutorials.mnist import input_data
mnist = input_data.read_data_sets('/Users/quxiaoyuan/work/data/mnist',one_hot=True)
with tf.name_scope('input'):
    x = tf.placeholder(tf.float32,[None,784],name='x-input')
    y_ = tf.placeholder(tf.float32,[None,10],name='y-input')
with tf.name_scope('softmax_layer'):
    with tf.name_scope('weights'):
        weights = tf.Variable(tf.zeros([784,10]))
    with tf.name_scope('biases'):
        biases = tf.Variable(tf.zeros([10]))
    with tf.name_scope('Wx_plus_b'):
        y = tf.matmul(x,weights) + biases

with tf.name_scope('cross_entropy'):
    diff = tf.nn.softmax_cross_entropy_with_logits(labels=y_,logits=y)
    with tf.name_scope('total'):
        cross_entropy = tf.reduce_mean(diff)
        tf.summary.scalar('cross_entropy',cross_entropy)
with tf.name_scope('train'):
    train_step = tf.train.AdamOptimizer(0.001).minimize(cross_entropy)

with tf.name_scope('accuracy'):
    with tf.name_scope('correct_prediction'):
        correct_prediction = tf.equal(tf.argmax(y,1),tf.argmax(y_,1))
    with tf.name_scope('accuracy'):
        accuracy = tf.reduce_mean(tf.cast(correct_prediction,tf.float32))
3.ft.summary操作
add_summay生成折线图


with tf.name_scope('cross_entropy'):
    diff = tf.nn.softmax_cross_entropy_with_logits(labels=y_,logits=y)
    with tf.name_scope('total'):
        cross_entropy = tf.reduce_mean(diff)
        tf.summary.scalar('cross_entropy',cross_entropy)

with tf.name_scope('train'):
    train_step = tf.train.AdamOpimizer(0.01).minimize(cross_entropy)

with tf.name_scope('accuracy'):
    with tf.name_scope('correct_prediction'):
        correct_prediction = tf.equal(tf.argmax(y,1),tf.argmax(y_,1))
    with tf.name_scope('accuracy'):
        accuracy = tf.reduce_mean(tf.cast(correct_prediction,tf.float32))
        tf.summary.scalar('accuracy',accuracy)

merged = tf.summary.merge_all()
for i in range(FLAGS.max_step):
    if i % FLAGS.max_step == 0:
        summary, acc = sess.run([merged,accuracy],feed_dict=feed_dict(False))
        witer.add_summary(summary,i)
histogram生成数据分布图
with tf.name_scope('softmax_layer'):
    with tf.name_scope('weights'):
        weights = tf.Variable(tf.zeros([784,10]))
        tf.summary.histogram('weights',weights)
tf.summary.image生成图像
with tf.name_scope('input'):
    x = tf.placeholder(tf.float32,[None,784],name='x-input')
    y_ = tf.placeholder(tf.float32,[None,10],name='y-input')

with tf.name_scope('input_reshape'):
    image_shaped_input = tf.reshape(x,[-1,28,28,1])
    tf.summary.image('input',image_shaped_input,10)