import matplotlib.pyplot as plt
#使用文本注解绘制树节点
#定义文本框和箭头格式
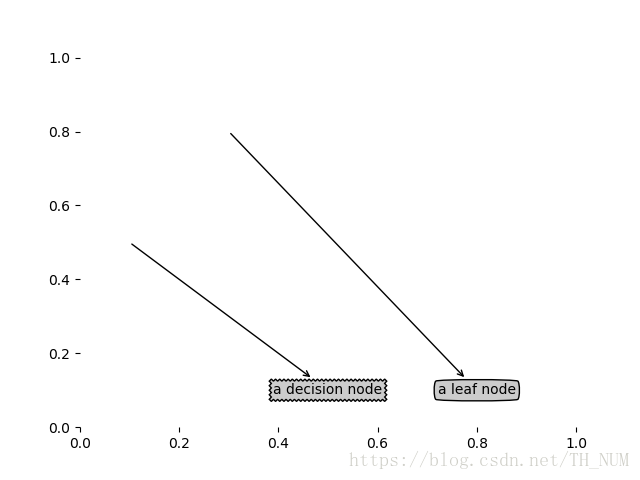
decisionNode=dict(boxstyle="sawtooth",fc="0.8")
leafNode=dict(boxstyle="round4",fc="0.8")
arrow_args=dict(arrowstyle="<-")
def plotNode(nodeTxt,centerPt,parentPt,nodeType):
createPlot.ax1.annotate(nodeTxt, xy=parentPt, xycoords='axes fraction',
xytext=centerPt, textcoords='axes fraction',
va="center", ha="center", bbox=nodeType, arrowprops=arrow_args)
def createPlot():
fig = plt.figure(1, facecolor='white')
fig.clf()
createPlot.ax1 = plt.subplot(111, frameon=False) #ticks for demo puropses
plotNode('a decision node', (0.5, 0.1), (0.1, 0.5), decisionNode)
plotNode('a leaf node', (0.8, 0.1), (0.3, 0.8), leafNode)
plt.show()
createPlot()图片: