一、Logstash介绍
ELK stack任务栈中还有另外两个很关键的组件Logstash和Kibana;Logstash是一个开源数据收集引擎,具有实时管道功能。Logstash可以动态的将来自不同数据源的数据统一起来,并将数据标准化到你所选择的目的地。Logstash支持多种数据的获取机制,通过TCP/UDP协议、文件、syslog、windows EventLogs及STDID等;获取到数据后,它支持对数据执行过滤、修改等操作,并把数据输出到用户指定的位置,Logstash是基于JRuby语言所研发,运行在JVM虚拟机上,运行架构为agent/server模式。

二、Logstash的工作流程
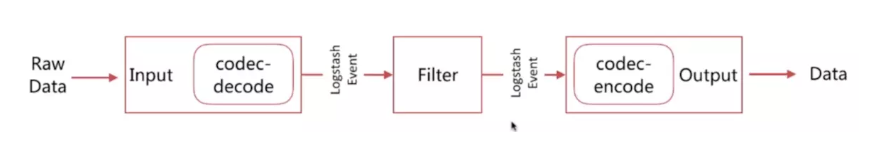
Logstash的工作流程由四类基础插件所执行;Input插件:采集各种样式、大小和来源的数据,数据往往以各种各样的形式、或分散或集中的存在于很多的系统中。Logstash支持各种输入选择,可以在同一时间从众多常用的数据来源获取数据,能够以连续的流式传输方式,轻松的从日志、指标、Web应用、数据存储以及各种AWS服务采集数据。

Filter过滤器:实时解析和转换数据;数据从源传输到存储库中,Logstash过滤器能够解析各个事件,识别已经命名的字段的构建结构,并将它们转换成通用的个数,以便更轻松、更快速的分析和实现商业价值。
Logstash能够动态的转换和解析数据,不受格式或复杂度的影响:
1)利用Grok从非结构化数据中派生出结构
2)从IP地址破译出地理坐标
3)将PII数据匿名化,完全排除敏感字段
4)整体处理不受数据源、格式或架构影响

Codec插件:用来对数据做解码编码,修改数据格式;
Output插件:对最后所得到的数据做输出进行存储,用户可以将数据发送到所指定的地方,例如输出到Elasticsearch中进行存储,也可以输出到标准输出;

Logstash所支持的数据类型:
Array:[item1,item2,…]
Boolean:true,false
Bytes:
Codec:编码器
Hash:key => value
Number:
Password:
Path:文件系统路径;
String:字符串
Logstash所支持的条件判断语句:
| 名称 | 符号 |
|---|---|
| 等于 | == |
| 不等于 | != |
| 小于 | < |
| 大于 | > |
| 大于等于 | >= |
| 小于等于 | <= |
| 匹配正则 | =~ |
| 不匹配正则 | !~ |
| 包含 | in |
| 不包含 | not in |
| 与 | and |
| 或 | or |
| 非与 | nand |
| 非或 | xor |
| 复合表达式 | () |
| 取反符号 | !() |
三、Logstash应用
1)读取标准输入和标准输出
[root@node1 config]# vim stdin.conf
input {
    stdin {}
}

output {
    stdout {
      codec => rubydebug
 }
}

[root@node1 config]# ../bin/logstash  -f   stdin.conf
Sending Logstash logs to /usr/local/logstash/logs which is now configured via log4j2.properties
[2019-12-14T20:54:12,970][WARN ][logstash.config.source.multilocal] Ignoring the 'pipelines.yml' file because modules or command line options are specified
[2019-12-14T20:54:12,999][INFO ][logstash.runner          ] Starting Logstash {"logstash.version"=>"6.6.2"}
[2019-12-14T20:54:20,844][INFO ][logstash.pipeline        ] Starting pipeline {:pipeline_id=>"main", "pipeline.workers"=>2, "pipeline.batch.size"=>125, "pipeline.batch.delay"=>50}
[2019-12-14T20:54:21,086][INFO ][logstash.pipeline        ] Pipeline started successfully {:pipeline_id=>"main", :thread=>"#<Thread:0x55c18421 run>"}
The stdin plugin is now waiting for input:
[2019-12-14T20:54:21,198][INFO ][logstash.agent           ] Pipelines running {:count=>1, :running_pipelines=>[:main], :non_running_pipelines=>[]}
[2019-12-14T20:54:21,499][INFO ][logstash.agent           ] Successfully started Logstash API endpoint {:port=>9600}
Hello Logstash
{
    "@timestamp" => 2019-12-14T12:55:19.649Z,
      "@version" => "1",
          "host" => "node1",
       "message" => "Hello Logstash"
}
2)读取系统message日志
[root@node1 config]# vim filesample.conf

input {
   file {
      path => ["/var/log/messages"]
      type => "system"
      start_position => "beginning"
  }
}

output {
    stdout {
       codec => rubydebug
  }
}


##  启动Logstash程序  ##
[root@node1 config]# ../bin/logstash  -f filesample.conf
{
    "@timestamp" => 2019-12-14T07:07:40.185Z,
       "message" => "Dec 14 15:07:03 node1 rsyslogd: [origin software=\"rsyslogd\" swVersion=\"8.24.0\" x-pid=\"1002\" x-info=\"http://www.rsyslog.com\"] rsyslogd was HUPed",
          "path" => "/var/log/messages",
          "type" => "system",
          "host" => "node1",
      "@version" => "1"
}
{
    "@timestamp" => 2019-12-14T07:08:28.742Z,
       "message" => "Dec 14 15:08:28 node1 systemd: Started firewalld - dynamic firewall daemon.",
          "path" => "/var/log/messages",
          "type" => "system",
          "host" => "node1",
      "@version" => "1"
}
{
    "@timestamp" => 2019-12-14T07:08:28.743Z,
       "message" => "Dec 14 15:08:28 node1 systemd: Reached target Network (Pre).",
          "path" => "/var/log/messages",
          "type" => "system",
          "host" => "node1",
      "@version" => "1"
}
3)从UDP端口读取数据流
udp:通过udp协议从网络连接来读取Message,其必备配置参数为port,
				用于指明自己监听的端口;host则用于指明自己监听的地址;
				collectd:性能监控程序;收集系统性能监控信息;

[root@node1 config]# yum install collectd
修改其配置文件:vim /etc/collectd.conf
		Hostname "node3.magedu.com"
		LoadPlugin syslog
		LoadPlugin cpu
		LoadPlugin df
		LoadPlugin load
		LoadPlugin memory
		LoadPlugin network
		<Plugin network>
			<Server "192.168.172.128" "25826">
			#192.168.172.128是logstash主机的地址,25826是其监听的udp端口;
			</Server>
		</Plugin>
		Include "/etc/collectd"
启动服务: systemctl start collectd.service
[root@node1 config]# vim udpsample.com
input {
    udp {
       port => 25826
       codec => collectd {}
       type => "collectd"
  }
}

output {
    stdout {
       codec => rubydebug
  }
}
[root@node1 config]# ../bin/logstash   -f udpsample.com
{
         "@timestamp" => 2019-12-14T13:12:22.389Z,
           "@version" => "1",
    "plugin_instance" => "sys-fs-cgroup",
               "host" => "node1",
              "value" => 0.0,
      "type_instance" => "used",
      "collectd_type" => "df_complex",
             "plugin" => "df",
               "type" => "collectd"
}
{
       "@timestamp" => 2019-12-14T13:12:22.389Z,
         "@version" => "1",
             "host" => "node1",
            "value" => 770539520.0,
    "type_instance" => "used",
    "collectd_type" => "memory",
           "plugin" => "memory",
             "type" => "collectd"
}
4)数据输出到redis数据库中
[root@node1 config]# yum install redis
[root@node1 config]# vim redis.conf
bind 0.0.0.0   ## 修改redis监听的地址为本机所有地址 ##
[root@node1 config]# systemctl start redis
[root@node1 config]# redis-cli -h 127.0.0.1  -p 6379
127.0.0.1:6379> KEYS *
(empty list or set)
127.0.0.1:6379>
127.0.0.1:6379> exit
[root@node1 config]# vim redis.conf
input {
    file {
       path => "/var/log/messages"
       type => "systemlog"
       start_position => "beginning"
    }
}

output {
    redis {
       data_type => "list"
       host => "192.168.172.128"
       port => "6379"
       key => "systemlog"
    }
}
[root@node1 config]# ../bin/logstash -f redis.conf
[root@node1 config]# redis-cli
127.0.0.1:6379> KEYS *
(empty list or set)
127.0.0.1:6379> exit
[root@node1 config]# redis-cli
127.0.0.1:6379> KEYS *
1) "systemlog"
127.0.0.1:6379> LLEN systemlog
(integer) 304
127.0.0.1:6379> LPOP systemlog
"{\"message\":\"Dec 14 18:01:01 node1 systemd: Starting Session 7 of user root.\",\"type\":\"systemlog\",\"path\":\"/var/log/messages\",\"host\":\"node1\",\"@version\":\"1\",\"@timestamp\":\"2019-12-14T13:25:42.831Z\"}"
127.0.0.1:6379> LLEN systemlog
(integer) 303
