pyecharts数字显示千位符
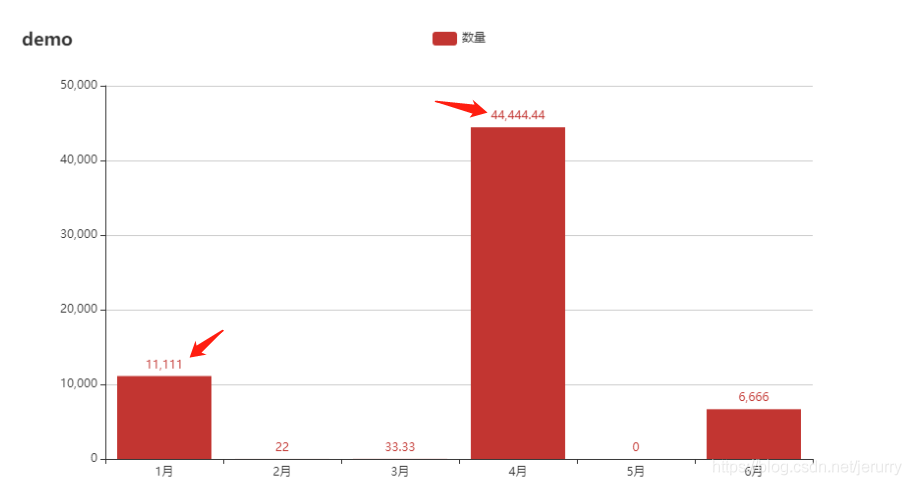
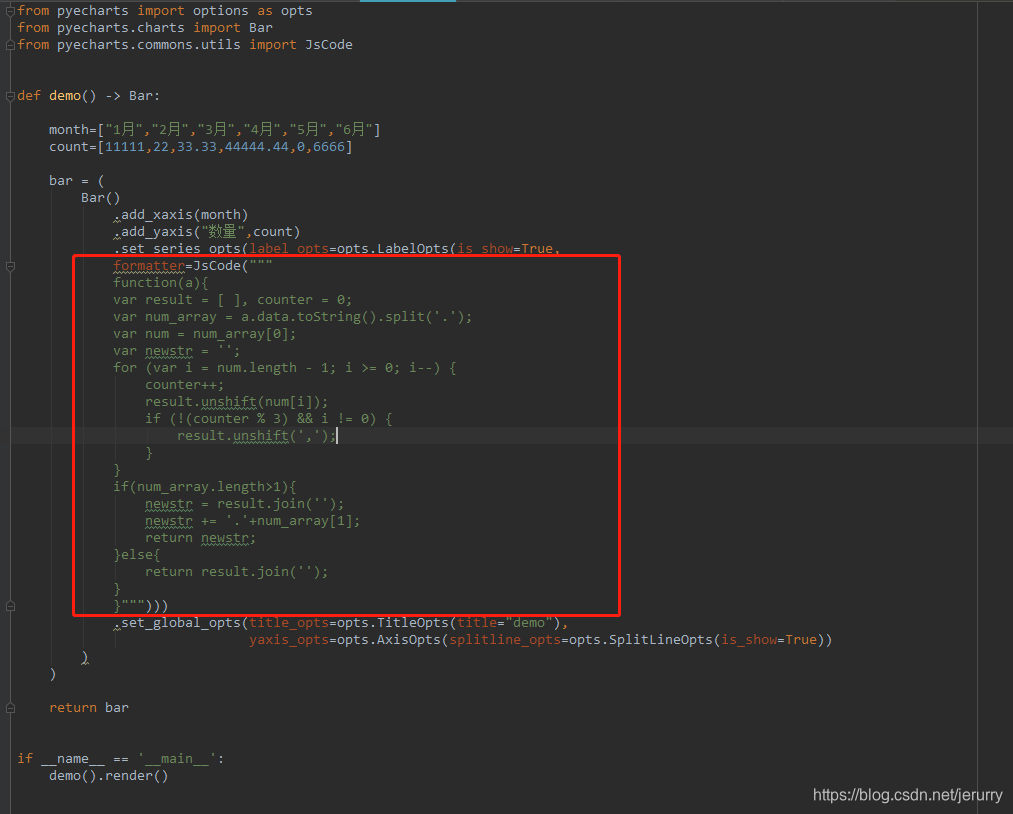
通过导入jsCode,在formatter中添加js代码实现
from pyecharts import options as opts
from pyecharts.charts import Bar
from pyecharts.commons.utils import JsCode


def demo() -> Bar:

    month=["1月","2月","3月","4月","5月","6月"]
    count=[11111,22,33.33,44444.44,0,6666]

    bar = (
        Bar()
            .add_xaxis(month)
            .add_yaxis("数量",count)
            .set_series_opts(label_opts=opts.LabelOpts(is_show=True, formatter=JsCode("""
            function(a){
            var result = [ ], counter = 0;
            var num_array = a.data.toString().split('.');
            var num = num_array[0];
            var newstr = '';
            for (var i = num.length - 1; i >= 0; i--) {
                counter++;
                result.unshift(num[i]);
                if (!(counter % 3) && i != 0) {
                    result.unshift(',');
                }
            }
            if(num_array.length>1){
                newstr = result.join('');
                newstr += '.'+num_array[1];
                return newstr;
            }else{
                return result.join('');
            }
            }""")))
            .set_global_opts(title_opts=opts.TitleOpts(title="demo"),
                             yaxis_opts=opts.AxisOpts(splitline_opts=opts.SplitLineOpts(is_show=True))
        )
    )

    return bar


if __name__ == '__main__':
    demo().render()
