代码
import cv2 as cv
import matplotlib.pyplot as plt
import numpy as np
def custom_hist(gray):
h, w = gray.shape
hist = np.zeros([256], dtype=np.int32)
for row in range(h):
for col in range(w):
pv = gray[row, col]
hist[pv] += 1
y_pos = np.arange(0, 256, 1, dtype=np.int32)
plt.bar(y_pos, hist, align='center', color='r', alpha=0.5)
plt.xticks(y_pos, y_pos)
plt.ylabel('Frequency')
plt.title('Histogram')
src = cv.imread('./bird.jpg', cv.IMREAD_COLOR)
gray = cv.cvtColor(src, cv.COLOR_RGB2GRAY)
cv.namedWindow('input', cv.WINDOW_AUTOSIZE)
cv.imshow('input', gray)
dst = cv.equalizeHist(gray)
cv.imshow('eh', dst)
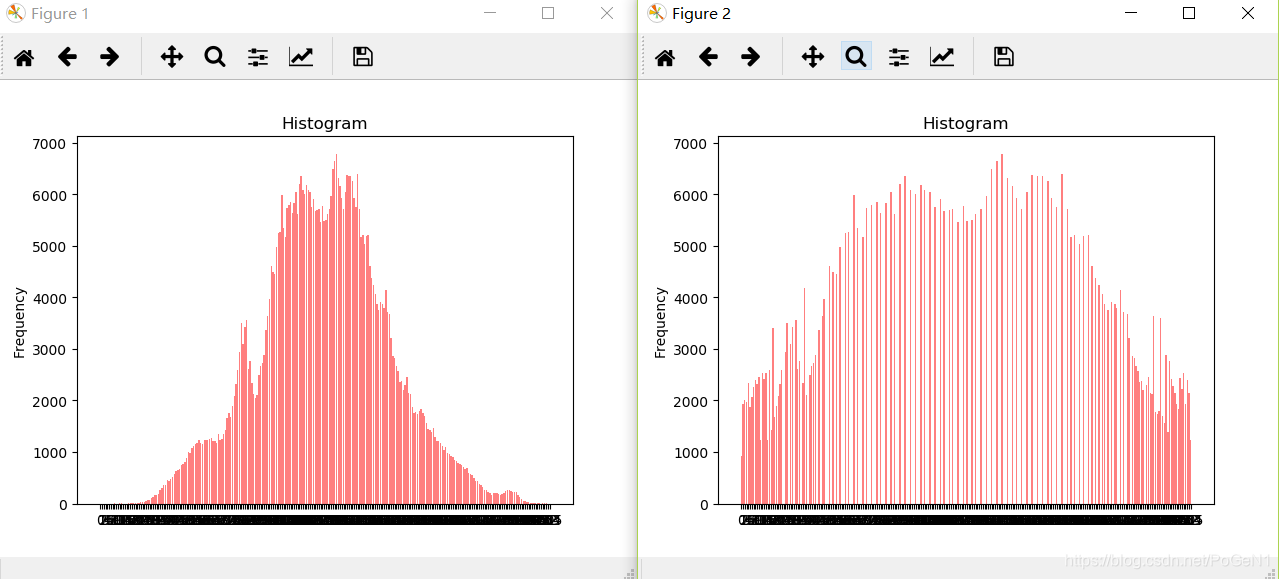
plt.figure(1)
custom_hist(gray)
plt.figure(2)
custom_hist(dst)
plt.show()
cv.waitKey(0)
cv.destroyAllWindows()
实验效果
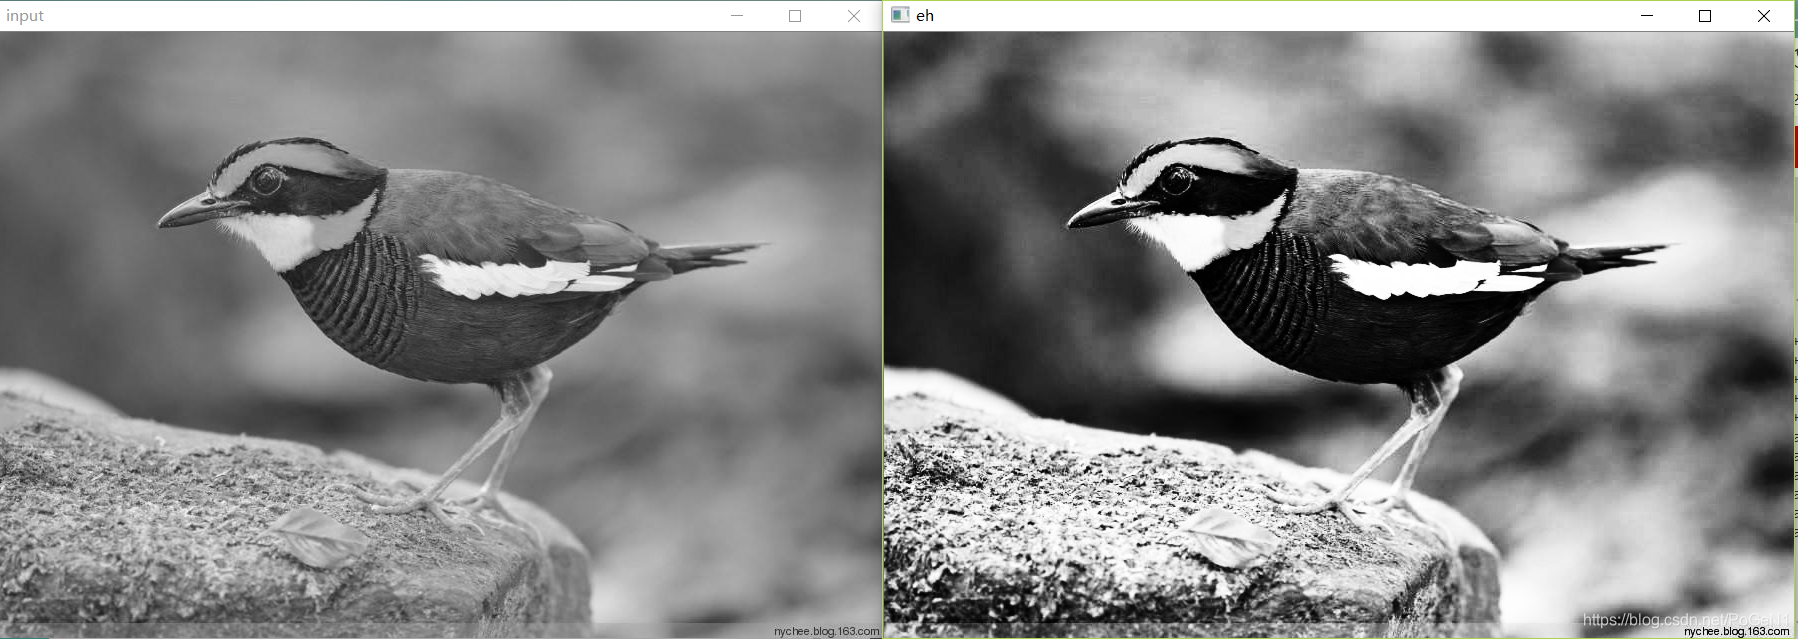
解释
图像直方图均衡化可以用于图像增强、对输入图像进行直方图均衡化处理,提升后续对象检测的准确率。此外对医学影像图像与卫星遥感图像也经常通过直方图均衡化来提升图像质量。
OpenCV中直方图均衡化的API很简单
- equalizeHist(src, dst)
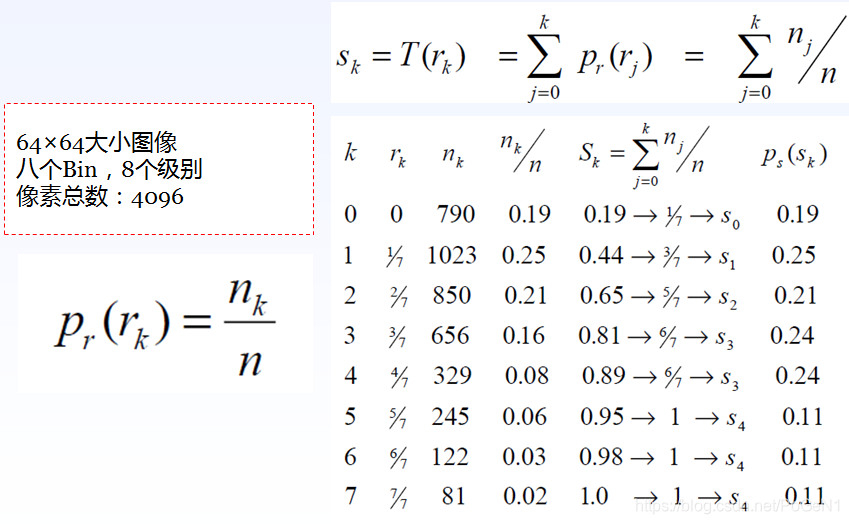
下图是图像均衡化的计算方式: