上一篇: 桑基图 https://blog.csdn.net/zjw_python/article/details/98611559
下一篇: 力导向图 https://blog.csdn.net/zjw_python/article/details/98617650
代码结构和初始化画布的Chart对象介绍,请先看 https://blog.csdn.net/zjw_python/article/details/98182540
本图完整的源码地址: https://github.com/zjw666/D3_demo/tree/master/src/sunburst/basicSunburst
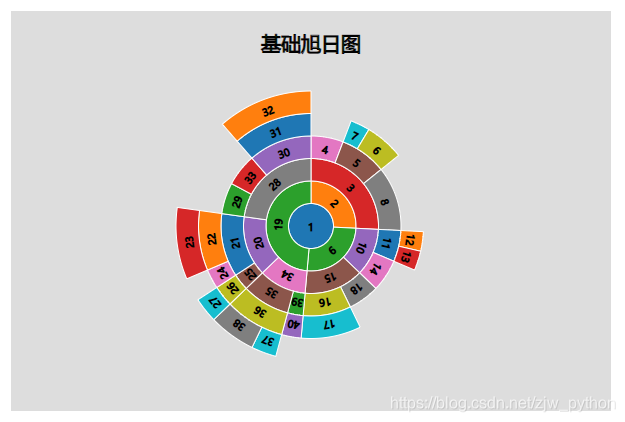
1 图表效果
2 数据
{
    "name": "alphabet",
    "children": [
        {
            "name": "a",
            "children": [
                {
                    "name": "a1",
                    "children": [
                        {"name": "a11", "house": 2},
                        {
                            "name": "a12",
                            "children":[
                                {
                                    "name" : "a121",
                                    "house" : 2
                                },
                                {
                                    "name" : "a122",
                                    "house" : 1
                                }
                            ]
                        },
                        {"name": "a13", "house": 4}
                    ]
                }
            ]
        },
        {
            "name": "b",
            "children": [
                {
                    "name": "b1",
                    "children": [
                        {
                            "name": "b12",
                            "children":[
                                {
                                    "name" : "b121",
                                    "house" : 1
                                },
                                {
                                    "name" : "b122",
                                    "house" : 1
                                }
                            ]
                        },
                        {"name": "b12", "house": 2}
                    ]
                },
                {
                    "name": "b2",
                    "children": [
                        {
                            "name": "b21",
                            "children":[
                                {
                                    "name" : "b211",
                                    "house" : 3
                                }
                            ]
                        },
                        {
                            "name" : "b22",
                            "house" : 2
                        }
                    ]
                }
            ]
        },
        {
            "name": "c",
            "children": [
                {
                    "name": "c1",
                    "children": [
                        {
                            "name": "c22",
                            "children":[
                                {
                                    "name" : "c221",
                                    "children": [
                                        {"name" : "c2211", "house" : 3}
                                    ]
                                },
                                {"name" : "c222", "house" : 1}
                            ]
                        },
                        {
                            "name": "c22",
                            "children":[
                                {
                                    "name" : "c221",
                                    "children": [
                                        {"name" : "c2211", "house" : 1}
                                    ]
                                }
                            ]
                        }
                    ]
                },
                {
                    "name": "c2",
                    "children": [
                        {"name": "c21", "house": 2},
                        {
                            "name": "c22",
                            "children":[
                                {
                                    "name" : "c221",
                                    "children": [
                                        {"name" : "c2211", "house" : 4}
                                    ]
                                }
                            ]
                        },
                        {"name": "c23", "house": 2}
                    ]
                },
                {

                    "name": "c3",
                    "children": [
                        {
                            "name": "c22",
                            "children":[
                                {
                                    "name" : "c221",
                                    "children": [
                                        {"name" : "c2211", "house" : 1},
                                        {"name" : "c2212", "house" : 2}
                                    ]
                                }
                            ]
                        },
                        {
                            "name": "c22",
                            "children":[
                                {
                                    "name" : "c221",
                                    "house" : 1
                                }
                            ]
                        }
                    ]
                }
            ]
        }

    ]
}
3 关键代码
导入数据
d3.json('./data.json').then(function(data){
.....
一些样式参数配置
const config = {
        margins: {top: 80, left: 50, bottom: 50, right: 50},
        textColor: 'black',
        title: '基础旭日图',
        hoverColor: 'gray',
        animateDuration: 1000,
    }
数据转换,为了之后动画过渡效果,这里给每个数据项都表示唯一性ID
chart._nodeId = 0;  //用于标识数据唯一性

data = addId(data);

function addId(d){     //给数据标识唯一性Id
    d.id = ++ chart._nodeId;
    if (d.children){
        d.children.forEach((item) => addId(item))
    }
    return d;
}
旭日图也是层次型数据结构,使用d3.hierarchy生成节点后,运用d3.partition为节点添加布局信息
const root = d3.hierarchy(data)
                    .sum((d) => d.house)
                    .sort((a,b) => a.value - b.value);

    chart.currentRoot = root.data.id;     //记录当前旭日图中心根节点id

    const partition = d3.partition()
                    .size([chart.getBodyWidth(), chart.getBodyHeight()])
                    .round(true);

    partition(root);

    let nodes = root.descendants();
尺度转换,由于布局函数添加的布局信息是笛卡尔坐标系的,因此我们要将值转换成极坐标系下的度量值
/* ----------------------------尺度转换------------------------  */

    chart.scaleXToAngle = d3.scaleLinear()
                              .domain([0, chart.getBodyWidth()])
                              .range([0, Math.PI * 2]);

    chart.scaleYToRadius = d3.scaleLinear()
                              .domain([0, chart.getBodyHeight()])
                              .range([0, d3.min([chart.getBodyWidth(), chart.getBodyHeight()]) / 2]);
渲染扇形,这里为了过渡动画效果,达到Echart这种效果,对扇形的半径和角度这两个属性都应用了中间帧函数计算
/* ----------------------------渲染扇形------------------------  */
    chart.renderSlice = function(){
        const slices = chart.body().selectAll('.slice')
                                .data(nodes, (d) => d.data.id);

        chart.slicesEnter = slices.enter()
                                    .append('g')
                                    .attr('transform', 'translate(' + chart.getBodyWidth()/2 + ',' + chart.getBodyHeight()/2 + ')')
                                    .attr('class', 'slice');

        chart.slicesEnter.append('path')
                            .attr('stroke', 'white')
                            .attr('fill', (d) => chart._colors(d.data.id % 10));

        chart.slicesEnter.merge(slices)
                            .select('path')
                                .transition().duration(config.animateDuration)
                                .attrTween('d', arcTween);

        slices.exit()
                .remove();

        function arcTween(d){                //圆弧的角度和半径过渡动画
            let currentRadius = this._currentR;

            if (!currentRadius){
                currentRadius = chart.scaleYToRadius(d.y1)
            }

            const interpolateR = d3.interpolate(    //只对外半径插值
                currentRadius,
                chart.scaleYToRadius(d.y1),
            )

            let currentArc = this._current;

            if (!currentArc){
                currentArc = {startAngle: 0, endAngle: 0};
            }

            const interpolateArc = d3.interpolate(     //对弧度插值
                currentArc,
                {
                    startAngle: chart.scaleXToAngle(d.x0),
                    endAngle: chart.scaleXToAngle(d.x1)
                }
            )

            this._current = interpolateArc(1);
            this._currentR = interpolateR(1);

            return function(t){
                let arc = d3.arc()
                        .outerRadius(interpolateR(t))
                        .innerRadius(chart.scaleYToRadius(d.y0));

                return arc(interpolateArc(t))
            };
        }
    }
渲染文本标签,文本标签的位置通过三角三角函数计算得出,并根据其所在角度旋转自身,适应布局
/* ----------------------------渲染文本标签------------------------  */
    chart.renderText = function(){
        const slices = chart.body().selectAll('.slice');

        chart.slicesEnter.append('text')
                            .attr('class', 'text')
                            .attr('stroke', config.textColor)
                            .attr('dy', 5)
                            .attr('text-anchor', 'middle');


        chart.slicesEnter.merge(slices)
                            .select('text')
                                .attr('x', (d) => getTextLocation(d, 'x'))
                                .attr('y', (d) => getTextLocation(d, 'y'))
                                .attr('transform', (d) => {
                                    let rotateAngle = (chart.scaleXToAngle(d.x0) + chart.scaleXToAngle(d.x1)) / 2 * 180 / Math.PI;
                                    if (chart.scaleYToRadius(d.y0) === 0) rotateAngle = 0;
                                    return 'rotate(' + rotateAngle + ' '+ getTextLocation(d, 'x') + ','+ getTextLocation(d, 'y') +')';
                                })
                                .text('')
                                .transition().delay(config.animateDuration)
                                .text((d) => d.data.id);


        function getTextLocation(d, type){     //获取文本的x和y坐标
            let middleRadius = 0;
            let middleAngle = 0;

            if (chart.scaleYToRadius(d.y0) > 0){
                middleAngle = (chart.scaleXToAngle(d.x0) + chart.scaleXToAngle(d.x1))/2;
                middleRadius = (chart.scaleYToRadius(d.y1) + chart.scaleYToRadius(d.y0))/2;
            }

            if (type === 'x'){
                return Math.sin(middleAngle) * middleRadius;
            }else if (type === 'y'){
                return -Math.cos(middleAngle) * middleRadius;
            }
        }
    }
绑定鼠标交互事件,这里主要有两个逻辑,点击中心节点回退一层,以及点击其他节点下钻一层,注意在重新计算布局时,不能直接将原节点传入,因为数据下钻后,节点的实际depth属性发生改变,否则会导致新布局中扇形的半径过渡失败
/* ----------------------------绑定鼠标交互事件------------------------  */
    chart.addMouseOn = function(){
        d3.selectAll('.slice')
            .on('click', function(d){
                if (d.data.id === chart.currentRoot){    //点击中心节点回退
                    if (d.parent){
                        const newD = d.parent.copy();
                        newD.parent = d.parent.parent;
                        partition(newD);
                        nodes = newD.descendants();
                        chart.currentRoot = d.parent.data.id;
                        chart.renderSlice();
                        chart.renderText();
                        chart.addMouseOn();
                    }
                }else{                        //点击其余节点下钻
                    const newD = d.copy();
                    newD.parent = d.parent;
                    partition(newD);
                    nodes = newD.descendants();
                    chart.currentRoot = d.data.id;
                    chart.renderSlice();
                    chart.renderText();
                    chart.addMouseOn();
                }
            });
    }
