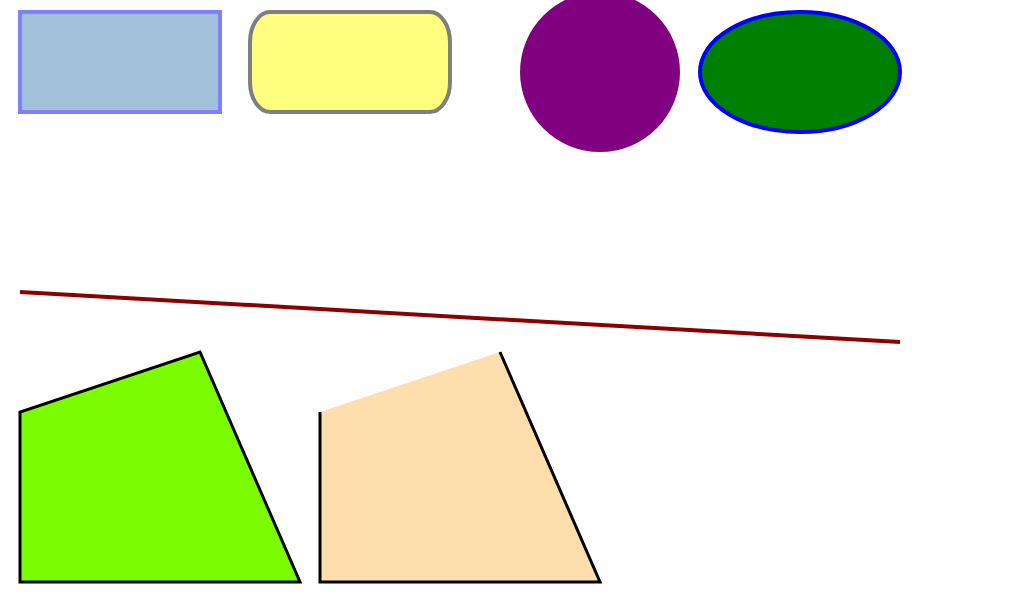
一,D3中的方形,圆形,椭园,多边形,折线的画法
和数学中定义差不多。直接SVG代码和图。
<!DOCTYPE html>
<svg width='1000' height='600' version='1.1'
    xmlns='http://www.w3.org/2000/svg'>
    <rect x='20' y='20' width='200' height='100'
        style='fill: steelblue; stroke: blue; stroke-width: 4; opacity: 0.5;' />

    <rect x='250' y='20' rx='20' ry='30' width='200' height='100'
        style='fill: yellow; stroke: black; stroke-width: 4; opacity: 0.5;' />

    <circle cx='600' cy='80' r='80'
        style='fill: purple; stroke: block; stroke-width: 4;' />
    <ellipse cx='800' cy='80' rx='100' ry='60'
        style='fill: green; stroke: blue; stroke-width: 4;'/>

    <line x1='20' y1='300' x2='900' y2='350'
        style='stroke: darkred; stroke-width: 4;' />

    <polygon points="20,420 20,590 300,590 200,360"
        style="fill: lawngreen; stroke: black; stroke-width: 3;" />

    <polyline points="320,420 320,590 600,590 500,360"
        style="fill: navajowhite; stroke: black; stroke-width: 3;" />
</svg>