QT技巧系列(3)QCustomPlot各部分颜色设置代码
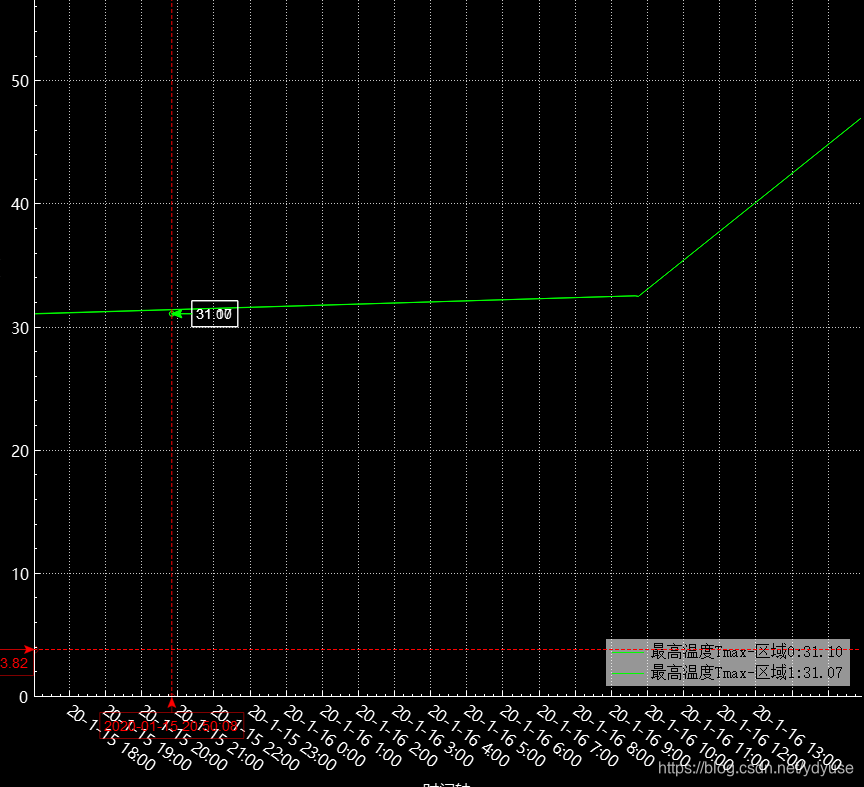
QCustomPlot 是一个基于Qt的画图和数据可视化C++控件。QCustomPlot 致力于提供美观的界面,高质量的2D画图、图画和图表,同时为实时数据可视化应用提供良好的解决方案。当QCustomPlot显示在有背景的窗体时,需要修改默认的一些颜色设置,不然有些地方显示不出来。下图如果窗体背景变为黑色,则坐标轴和文字就显示不出来。

通过设置不同部分的颜色来达到完美显示效果。
示例代码如下:
//2019-8-5如果整个界面要用背景的话,这个图形显示需要设置显示背景
ui->customPlot->setBackground(QBrush(Qt::black));
//设置坐标文本颜色
ui->customPlot->xAxis->setTickLabelColor(Qt::white);
ui->customPlot->yAxis->setTickLabelColor(Qt::white);

//设置坐标名称文本颜色
ui->customPlot->xAxis->setLabelColor(Qt::white);
ui->customPlot->yAxis->setLabelColor(Qt::white);
//设置坐标轴颜色
ui->customPlot->xAxis->setBasePen(QPen(Qt::white));
ui->customPlot->xAxis->setTickPen(QPen(Qt::white));
ui->customPlot->xAxis->setSubTickPen(QPen(Qt::white));
//设置label字体
QFont xFont = ui->customPlot ->xAxis->labelFont();
xFont.setPixelSize(20);
ui->customPlot ->xAxis->setLabelFont(xFont);
ui->customPlot->yAxis->setBasePen(QPen(Qt::white));
ui->customPlot->yAxis->setTickPen(QPen(Qt::white));
ui->customPlot->yAxis->setSubTickPen(QPen(Qt::white));
//设置坐标轴名称
ui->customPlot->xAxis->setLabel("时间轴");
ui->customPlot->yAxis->setLabel("温度(℃)");
设置后显示效果如下图:
注:实战示例,解疑答惑。
--不间端地思考,实时地批判你的工作!
