-
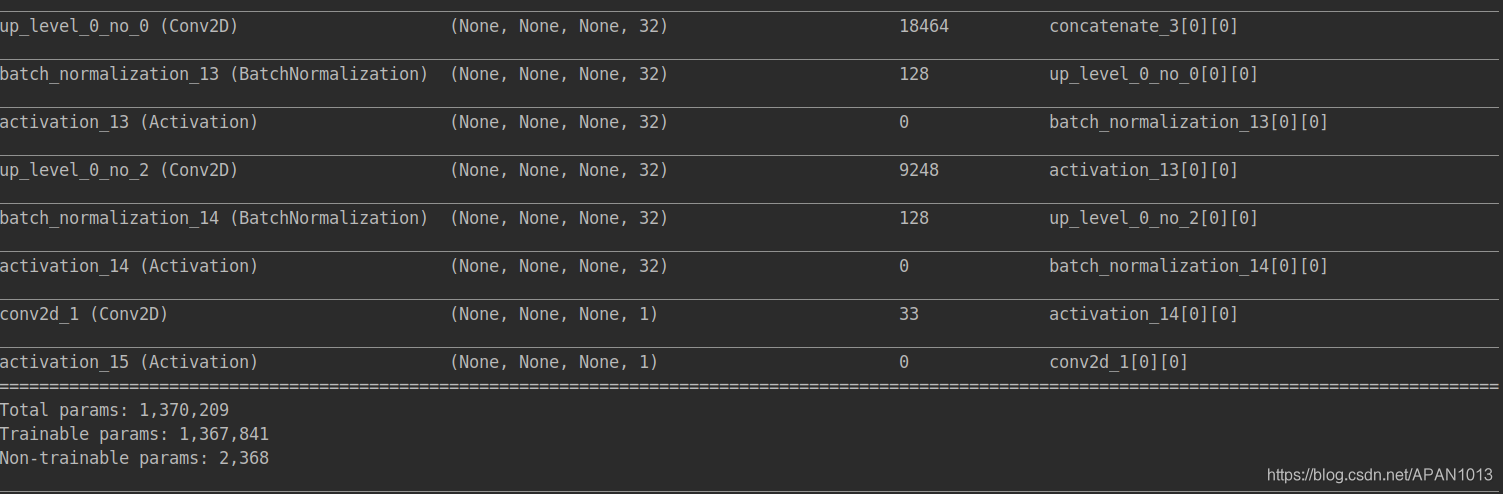
model.summary(line_length=150, positions=[0.30, 0.60, 0.7, 1.]
-
plot_model(model, to_file=’./model.png’, show_shapes=True)
需要 from keras.utils import plot_model
基于以下:
安装pydotplus库 将出错文件内pydot(python3.6不支持了)替换为 pydotplus
pip install pydotplus
安装graphviz库
sudo apt-get install graphviz

keras 显示模型结构

猜你喜欢
转载自blog.csdn.net/APAN1013/article/details/101456987
今日推荐
周排行