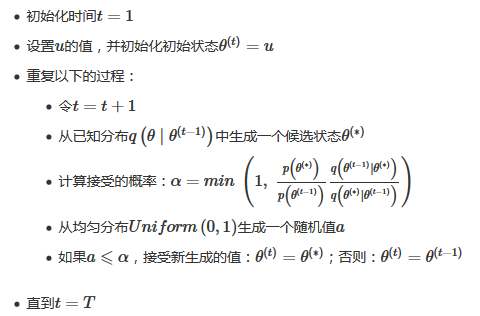
Metropolis-Hastings采样算法的流程:
代码一:有助于理解算法流程
# -*- coding: utf-8 -*-
'''
Created on 2018年5月15日

@author: user
'''
import random
from scipy.stats import norm
import matplotlib.pyplot as plt

def cauchy(theta):#从柯西分布p中采样数据
    y = 1.0 / (1.0 + theta ** 2)
    return y

T = 5000
sigma = 1
thetamin = -30
thetamax = 30
theta = [0.0] * (T+1)
theta[0] = random.uniform(thetamin, thetamax)

t = 0
while t < T:
    t = t + 1

    theta_star = norm.rvs(loc=theta[t - 1], scale=sigma, size=1, random_state=None)#从已知正态分布q中生成候选状态

    alpha = min(1, (cauchy(theta_star[0]) / cauchy(theta[t - 1])) )

    u = random.uniform(0, 1)
    if u <= alpha:#接受
        theta[t] = theta_star[0]
    else:
        theta[t] = theta[t - 1]

#print (theta)
ax1 = plt.subplot(211)
ax2 = plt.subplot(212)
plt.sca(ax1)
plt.ylim(thetamin, thetamax)
plt.plot(range(T+1), theta, 'g-')
plt.sca(ax2)
num_bins = 50
plt.hist(theta, num_bins, normed=1, facecolor='red', alpha=0.5)
plt.show()
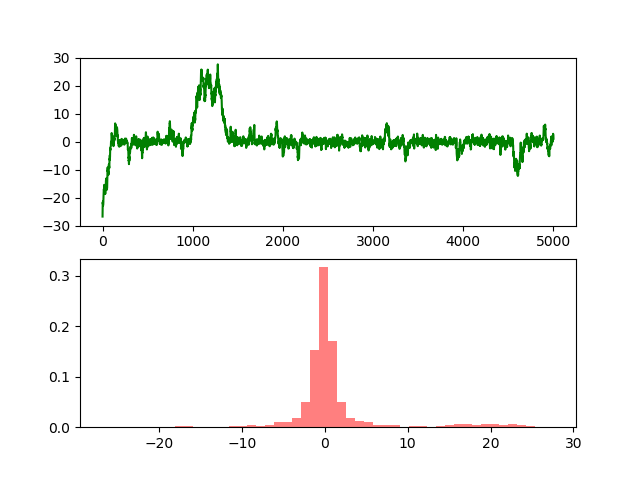
结果:
代码2:有助于理解样本
# -*- coding: utf-8 -*-
'''
Created on 2018年5月16日
@author: user
p:输入的概率分布,离散情况采用元素为概率值的数组表示
N:认为迭代N次马尔可夫链收敛
Nlmax:马尔可夫链收敛后又取的服从p分布的样本数
isMH:是否采用MH算法,默认为True
'''
from __future__ import division
import matplotlib.pyplot as plt
import numpy as np
from array import array
def mcmc(p,N=10000,Nlmax=10000,isMH=True):
A = np.array([p for y in range(len(p))], dtype=np.float64)
X0 = np.random.randint(len(p))
count = 0
samplecount = 0
L = array("d",[X0])
l = array("d")
while True:
X = int(L[samplecount])
cur = np.argmax(np.random.multinomial(1,A[X]))
count += 1
if isMH:
a = (p[cur]*A[cur][X])/(p[X]*A[X][cur])
alpha = min(a,1)
else:
alpha = p[cur]*A[cur][X]
u = np.random.uniform(0,1)
if u<alpha:
samplecount += 1
L.append(cur)
if count>N:
l.append(cur)
if len(l)>=Nlmax:
break
else:
continue
La = np.frombuffer(L)
la = np.frombuffer(l)
return La,la
def count(q,n):
L = array("d")
l1 = array("d")
l2 = array("d")
for e in q:
L.append(e)
for e in range(n):
l1.append(L.count(e))
for e in l1:
l2.append(e/sum(l1))
return l1,l2
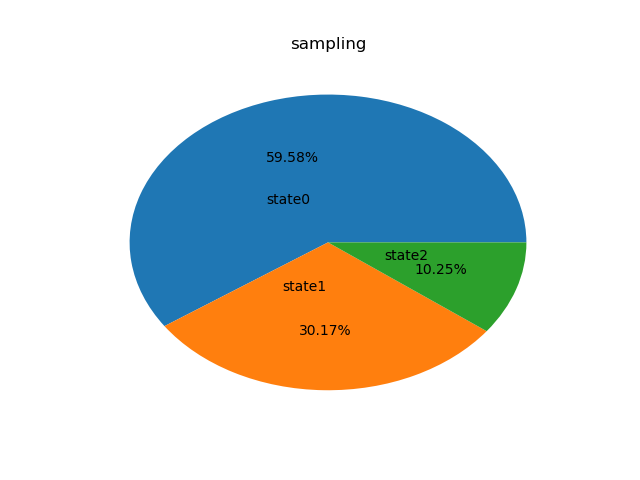
if __name__ == '__main__':
p = np.array([0.6,0.3,0.1])
a = mcmc(p)[1]
l1 = ['state%d'% x for x in range(len(p))]
plt.pie(count(a,len(p))[0],labels=l1,labeldistance=0.3,autopct='%1.2f%%')
plt.title("sampling")
plt.show()
结果: