一、主题式网络爬虫设计方案
1.主题式网络爬虫名称
爬取纵横中文网点击榜月榜
2.主题式网络爬虫爬取的内容与数据特征分析
爬取网站的“排名”,“类别”,“书名”,“状态”,“字数”,“点击数”,“作者”
3.主题式网络爬虫设计方案概述(包括实现思路与技术难点)
思路:通过分析网页源代码,找出数据所在的标签,通过爬虫读取数据保存到xlsx文件中,读取文件,对数据进行清洗和处理,数据分析与可视化处理。
技术难点:对数据的和其他方面的处理较为生疏
二、主题页面的结构特征分析
1.主题页面的结构与分析:爬取的“排名”标签为"rank_listnum",“类别”标签为“rankpage_list_box”,“书名”标签为“rankpage_list3”等等...
2.Htmls页面解析

三、网络爬虫程序设计
爬虫程序主体要包括以下各部分,要附源代码及较详细注释,并在每部分程序后面提供输出结果的截图。
1.数据爬取与采集:
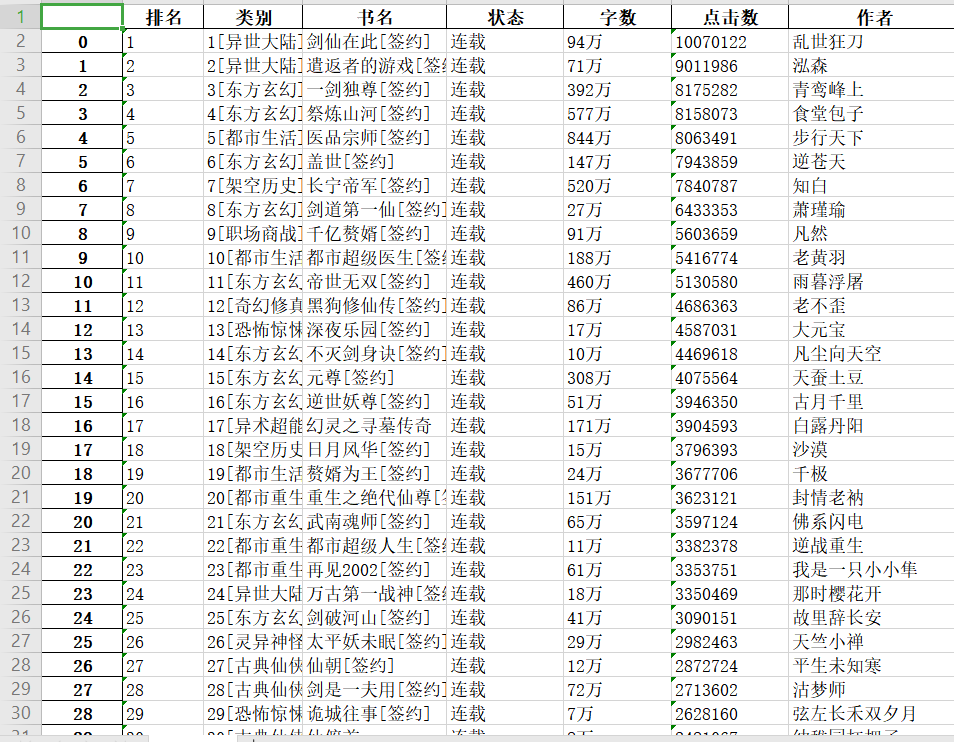
import requests
#引入requests库下载网页
from bs4 import BeautifulSoup
#BeautifulSoup解析网页
import pandas as pd
#引入pandas数据可视化
url = "http://www.zongheng.com/rank/details.html?rt=5&d=0&r=&i=2&c=0"
#纵横中文网点击榜月榜
headers = {'User-Agent':'Mozilla/5.0 (Windows NT 6.3; Win64; x64) AppleWebKit/537.36 (KHTML, like Gecko)Chrome/69.0.3497.100 Safari/537.36'}
#伪装爬虫
r=requests.get(url)
#请求网站
r.encoding=r.apparent_encoding
#对页面内容进行重新编码
x=r.text
#获取源代码
soup=BeautifulSoup(x,'lxml')
#构造Soup的对象
print(soup.prettify())
#显示网站结构
b=[]
#创建一个空列表
z=[]
#创建一个空列表
c=[]
#创建一个空列表
p=[]
#创建一个空列表
u=[]
#创建一个空列表
v=[]
#创建一个空列表
q=[]
#创建一个空列表
for g in soup.find_all(class_="rank_listnum"):
#for语句查找标签
    b.append(g.get_text().strip())
for n in soup.find_all(class_="rankpage_list_box"):
#for语句查找标签
    z.append(n.get_text().strip())
for i in soup.find_all(class_="rankpage_list3"):
#for语句查找标签
    c.append(i.get_text().strip())
for l in soup.find_all(class_="rankpage_list4"):
#for语句查找标签
    p.append(l.get_text().strip())
for o in soup.find_all(class_="rankpage_list5"):
#for语句查找标签
    u.append(o.get_text().strip())
for m in soup.find_all(class_="rankpage_list6"):
#for语句查找标签
    v.append(m.get_text().strip())
for f in soup.find_all(class_="rankpage_list7"):
#for语句查找标签
    q.append(f.get_text().strip())
data=[b,z,c,p,u,v,q]
print(data)
df=pd.DataFrame(data,index=["排名","类别","书名","状态","字数","点击数","作者"])
#使用工具使其可视化
print(df.T)
#将所得数据进行可视化

S="E:\SteamLibrary\纵横中文网点击榜月榜.xlsx"
#将数据保存在新的文本中
df.T.to_excel(S)

2.对数据进行清洗和处理:
df = pd.DataFrame(pd.read_excel('E:\SteamLibrary\纵横中文网点击榜月榜.xlsx'))
#读取excel文件
df.head()
df.drop('书名', axis=1, inplace = True)
#删除无效列与行
df.drop('作者', axis=1, inplace = True)
#删除无效列与行
df.drop('状态', axis=1, inplace = True)
#删除无效列与行
df.drop('字数', axis=1, inplace = True)
#删除无效列与行
df.drop('类别', axis=1, inplace = True)
#删除无效列与行
df.head()

#数据清洗
print('\n====各列是否有缺失值情况如下:====')
print(df.isnull().sum())
#返回0,表示没有空值
print(df.duplicated())
#检查是否有重复值
#缺失值处理
df[df.isnull().values==True]
#返回无缺失值
print(df.isna().head())
print(df.describe())
#用describe()命令显示描述性统计指标


3.数据分析与可视化:
import matplotlib.pyplot as plt
import matplotlib
matplotlib.rcParams['font.sans-serif']=['SimHei']
x =['剑仙在此','遣返者的游戏','一剑独尊','医品宗师','祭炼山河','盖世','长宁帝军','剑道第一仙','千亿赘婿','都市超级医生']
y = [1,2,3,4,5,6,7,8,9,10]
plt.plot(x,y)
plt.xlabel("书名")
plt.ylabel("排名")
plt.title('点击数')
plt.show()

#绘制排名与点击数的回归图
plt.rcParams['font.sans-serif']=['STSong']#显示中文
sns.regplot(df.排名,df.点击数)
#绘制垂直柱状图
plt.rcParams['axes.unicode_minus']=False #用来正常显示负号
plt.bar(df.排名, df.点击数, label="排名与点击数柱状图")
plt.show()

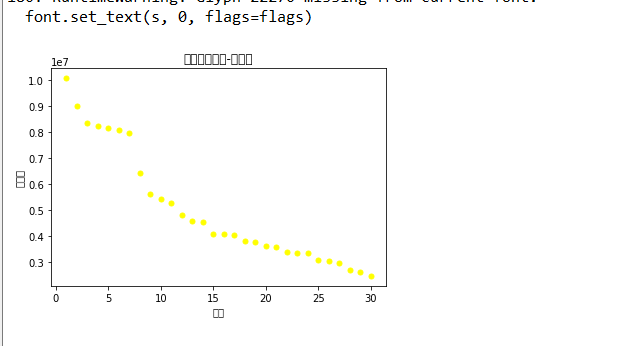
# 绘制散点图
def Scatter_point():

    plt.scatter(df.排名, df.点击数, color='yellow', s=25, marker="o")
    plt.xlabel("排名")
    plt.ylabel("点击数")
    plt.title("排名与点击数-散点图")
    plt.show()

Scatter_point()
#绘制排名与点击数折线图
def draw():

    x = df['排名']
    y = df['点击数']
    plt.xlabel('排名')
    plt.ylabel('点击数')
    plt.plot(x,y)
    plt.scatter(x,y)
    plt.title("绘制排名与点击数折线图")
    plt.show()

draw()

#绘制部分箱体图
import seaborn as sns
file_path="E:\SteamLibrary\纵横中文网点击榜月榜.xlsx"
sns.boxplot(x='排名',y='点击数',data=df)

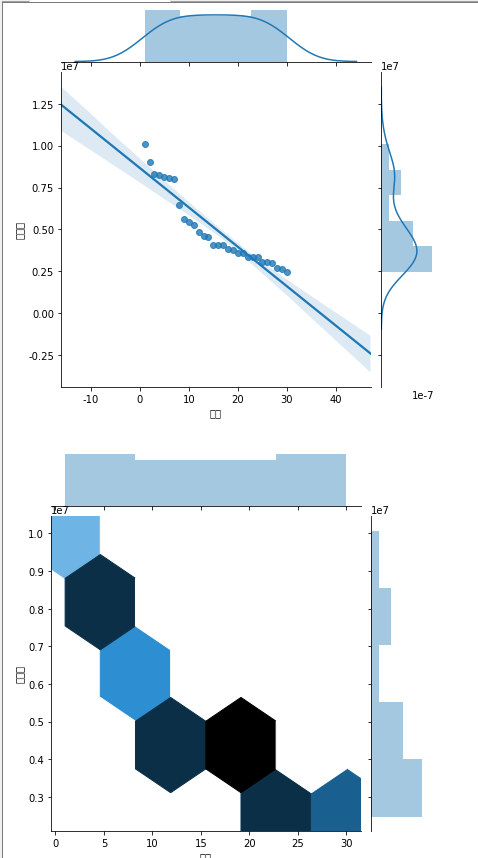
#绘制部分分布图
sns.jointplot(x="排名",y='点击数',data = df, kind='kde', color='y')

sns.jointplot(x="排名",y='点击数',data = df)

sns.jointplot(x="排名",y='点击数',data = df, kind='reg')

sns.jointplot(x="排名",y='点击数',data = df, kind='hex')

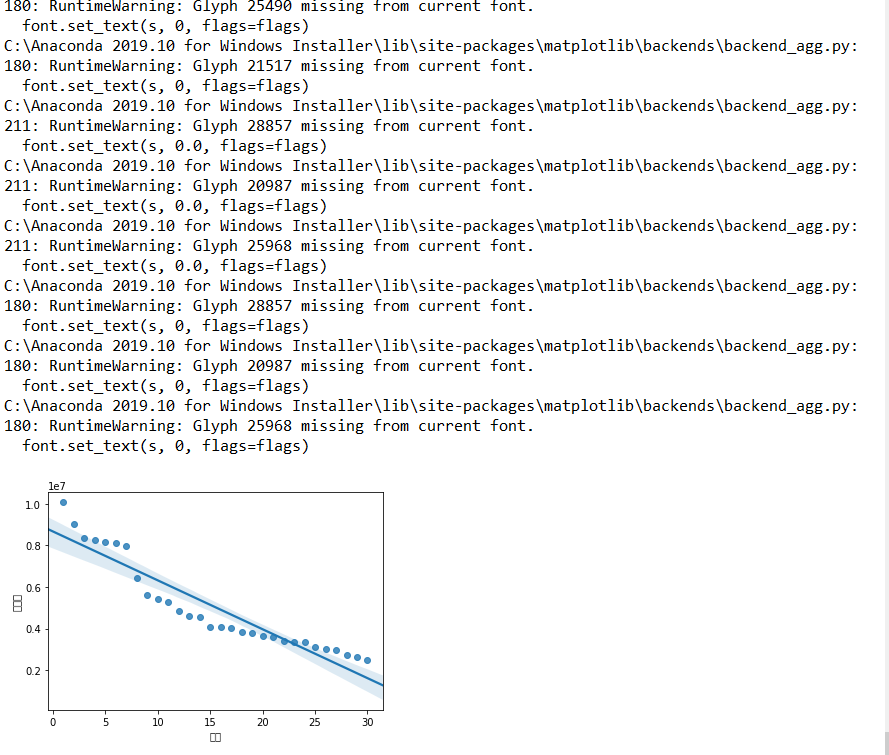
4.根据数据之间的关系,分析两个变量之间的相关系数,画出散点图,并建立变量之间的回归方程(一元或多元):
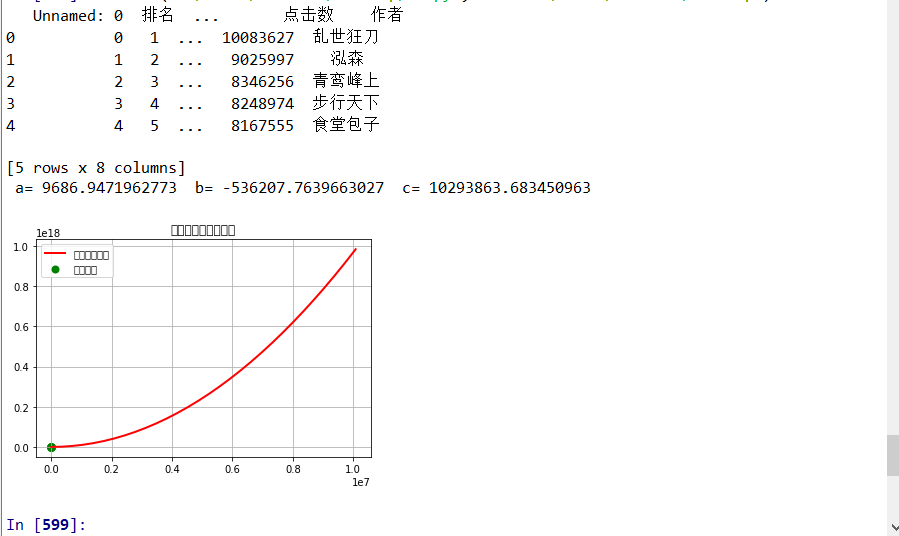
import seaborn as sns
from scipy.optimize import leastsq
df=pd.DataFrame(pd.read_excel('E:\SteamLibrary\纵横中文网点击榜月榜.xlsx'))
print(df.head())
X = df.排名
Y = df.点击数
def func(params, x):
    a, b, c = params
    return a*x*x+b*x+c
def error(params,x,y):
    return func(params,x)-y
def main(a,b,c):
    p0 = [0,0,0]
Para=leastsq(error,p0,args=(X,Y))
a,b,c=Para[0]
print(" a=",a," b=",b," c=",c)
plt.scatter(X,Y,color="green",label=u"评分分布",linewidth=2)
x=np.linspace(1,10082854,30)
y=a * x * x + b * x + c
plt.plot(x,y,color="red",label=u"回归方程直线",linewidth=2)
plt.title("排名与点击数关系图")
plt.legend()
plt.grid()
plt.show()
def draw_scatterplot(surface, options, dataSet):
    chart = pycha.scatter.ScatterplotChart(surface,options)
    chart.addDataset(dataSet)
    chart.render()
    surface.write_to_png('D:\python\排名与点击数关系图.png')


a=()
b=()
c=()
5.将以上各部分的代码汇总,附上完整程序代码:
import requests
#引入requests库下载网页
from bs4 import BeautifulSoup
#BeautifulSoup解析网页
import pandas as pd
#引入pandas数据可视化
url = "http://www.zongheng.com/rank/details.html?rt=5&d=0&r=&i=2&c=0"
#纵横中文网点击榜月榜
headers = {'User-Agent':'Mozilla/5.0 (Windows NT 6.3; Win64; x64) AppleWebKit/537.36 (KHTML, like Gecko)Chrome/69.0.3497.100 Safari/537.36'}
#伪装爬虫
r=requests.get(url)
#请求网站
r.encoding=r.apparent_encoding
#对页面内容进行重新编码
x=r.text
#获取源代码
soup=BeautifulSoup(x,'lxml')
#构造Soup的对象
print(soup.prettify())
#显示网站结构
b=[]
#创建一个空列表
z=[]
#创建一个空列表
c=[]
#创建一个空列表
p=[]
#创建一个空列表
u=[]
#创建一个空列表
v=[]
#创建一个空列表
q=[]
#创建一个空列表
for g in soup.find_all(class_="rank_listnum"):
#for语句查找标签
    b.append(g.get_text().strip())
for n in soup.find_all(class_="rankpage_list_box"):
#for语句查找标签
    z.append(n.get_text().strip())
for i in soup.find_all(class_="rankpage_list3"):
#for语句查找标签
    c.append(i.get_text().strip())
for l in soup.find_all(class_="rankpage_list4"):
#for语句查找标签
    p.append(l.get_text().strip())
for o in soup.find_all(class_="rankpage_list5"):
#for语句查找标签
    u.append(o.get_text().strip())
for m in soup.find_all(class_="rankpage_list6"):
#for语句查找标签
    v.append(m.get_text().strip())
for f in soup.find_all(class_="rankpage_list7"):
#for语句查找标签
    q.append(f.get_text().strip())
data=[b,z,c,p,u,v,q]
print(data)
df=pd.DataFrame(data,index=["排名","类别","书名","状态","字数","点击数","作者"])
#使用工具使其可视化
print(df.T)
#将所得数据进行可视化

S="E:\SteamLibrary\纵横中文网点击榜月榜.xlsx"
#将数据保存在新的文本中
df.T.to_excel(S)

df = pd.DataFrame(pd.read_excel('E:\SteamLibrary\纵横中文网点击榜月榜.xlsx'))
#读取excel文件
df.head()
df.drop('书名', axis=1, inplace = True)
#删除无效列与行
df.drop('作者', axis=1, inplace = True)
#删除无效列与行
df.drop('状态', axis=1, inplace = True)
#删除无效列与行
df.drop('字数', axis=1, inplace = True)
#删除无效列与行
df.drop('类别', axis=1, inplace = True)
#删除无效列与行
df.head()


#数据清洗
print('\n====各列是否有缺失值情况如下:====')
print(df.isnull().sum())
#返回0,表示没有空值
print(df.duplicated())
#检查是否有重复值
df[df.isnull().values==True]
#返回无缺失值
print(df.isna().head())
print(df.describe())
#用describe()命令显示描述性统计指标

import matplotlib.pyplot as plt
import matplotlib
matplotlib.rcParams['font.sans-serif']=['SimHei']
x =['剑仙在此','遣返者的游戏','一剑独尊','医品宗师','祭炼山河','盖世','长宁帝军','剑道第一仙','千亿赘婿','都市超级医生']
y = [1,2,3,4,5,6,7,8,9,10]
plt.plot(x,y)
plt.xlabel("书名")
plt.ylabel("排名")
plt.title('点击数')
plt.show()

import seaborn as sns
#绘制排名与点击数的回归图
plt.rcParams['font.sans-serif']=['STSong']#显示中文
sns.regplot(df.排名,df.点击数)


#绘制垂直柱状图
plt.rcParams['axes.unicode_minus']=False


#用来正常显示负号

plt.bar(df.排名, df.点击数, label="排名与点击数柱状图")


plt.show()


# 绘制散点图
def Scatter_point():

    plt.scatter(df.排名, df.点击数, color='yellow', s=25, marker="o")
    plt.xlabel("排名")
    plt.ylabel("点击数")
    plt.title("排名与点击数-散点图")
    plt.show()

Scatter_point()


#绘制排名与点击数折线图
def draw():

    x = df['排名']
    y = df['点击数']
    plt.xlabel('排名')
    plt.ylabel('点击数')
    plt.plot(x,y)
    plt.scatter(x,y)
    plt.title("绘制排名与点击数折线图")
    plt.show()

draw()


#绘制部分箱体图
import seaborn as sns

file_path="E:\SteamLibrary\纵横中文网点击榜月榜.xlsx"

sns.boxplot(x='排名',y='点击数',data=df)


#绘制部分分布图
sns.jointplot(x="排名",y='点击数',data = df, kind='kde', color='y')

sns.jointplot(x="排名",y='点击数',data = df)

sns.jointplot(x="排名",y='点击数',data = df, kind='reg')

sns.jointplot(x="排名",y='点击数',data = df, kind='hex')


#绘制排名与点击数关系图
import numpy as np
import seaborn as sns
from scipy.optimize import leastsq
df=pd.DataFrame(pd.read_excel('E:\SteamLibrary\纵横中文网点击榜月榜.xlsx'))
print(df.head())
X = df.排名
Y = df.点击数
def func(params, x):
    a, b, c = params
    return a*x*x+b*x+c
def error(params,x,y):
    return func(params,x)-y
def main(a,b,c):
    p0=[0,0,0]
Para=leastsq(error,p0,args=(X,Y))
a,b,c=Para[0]
print(" a=",a," b=",b," c=",c)
plt.scatter(X,Y,color="green",label=u"评分分布",linewidth=2)
x=np.linspace(1,10082854,30)
y=a * x * x + b * x + c
plt.plot(x,y,color="red",label=u"回归方程直线",linewidth=2)
plt.title("排名与点击数关系图")
plt.legend()
plt.grid()
plt.show()


a=()
b=()
c=()
四、结论(10分)
1.经过对主题数据的分析与可视化,可以得到哪些结论?
结论:通过对数据的分析与可视化,各数据之间的关系和呈现出来的分布,让数据的分析变的更容易起来。对于绘制图形方面的时候我们需要整理好正确的数据,这样才可以绘制出正确的图示。
2.对本次程序设计任务完成的情况做一个简单的小结。
小结:通过这次做题任务,我明白了数据的分析与可视化,掌握了不少库的使用,但对网络爬取掌握的还不够熟练。我在一些像是B站的平台上求助一些专业的老师,向他们求教,在此期间,我对python的学习有了更深的了解,也对这门课程更加的感兴趣了。