文章目录
learn from https://www.kaggle.com/learn/pandas
上一篇:Pandas入门1(DataFrame+Series读写/Index+Select+Assign)
下一篇:Pandas入门3(dtype+fillna+replace+rename+concat+join)
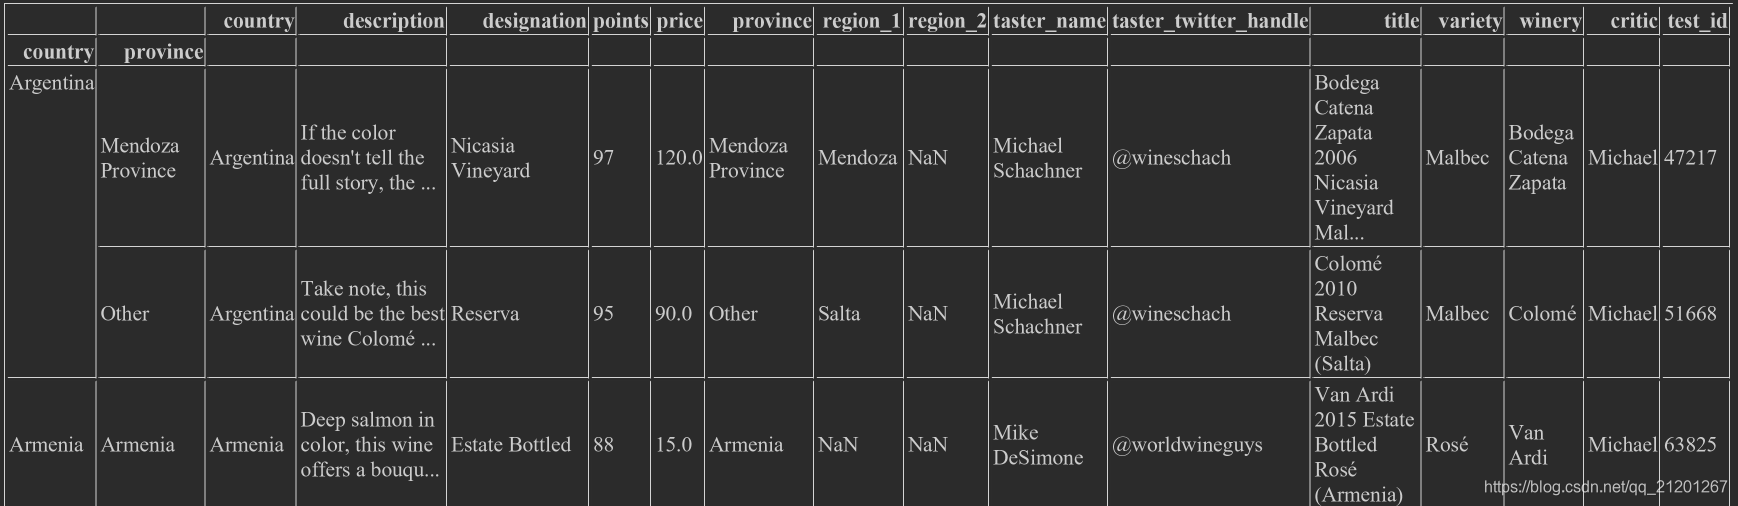
3. Summary Functions and Maps
3.1 Summary Functions 数据总结函数
3.1.1 describe()
wine_rev.points.describe(),各种统计信息,数字信息总结
# 数字列的总结
count    129971.000000
mean         88.447138
std           3.039730
min          80.000000
25%          86.000000
50%          88.000000
75%          91.000000
max         100.000000
Name: points, dtype: float64
wine_rev.country.describe(),文字信息总结
# 文字类列的总结
count     129908
unique        43
top           US
freq       54504
Name: country, dtype: object
3.1.2 mean(),median(),idxmax(),unique(),value_counts()
wine_rev.points.mean(),均值,median(),中位数,idxmax(),最大数据的下标wine_rev.country.unique(),不同的值多少个
array(['Italy', 'Portugal', 'US', 'Spain', 'France', 'Germany',
       'Argentina', 'Chile', 'Australia', 'Austria', 'South Africa',
       'New Zealand', 'Israel', 'Hungary', 'Greece', 'Romania', 'Mexico',
       'Canada', nan, 'Turkey', 'Czech Republic', 'Slovenia',
       'Luxembourg', 'Croatia', 'Georgia', 'Uruguay', 'England',
       'Lebanon', 'Serbia', 'Brazil', 'Moldova', 'Morocco', 'Peru',
       'India', 'Bulgaria', 'Cyprus', 'Armenia', 'Switzerland',
       'Bosnia and Herzegovina', 'Ukraine', 'Slovakia', 'Macedonia',
       'China', 'Egypt'], dtype=object)
wine_rev.country.value_counts(),各个值的计数
US                        54504
France                    22093
Italy                     19540
Spain                      6645
.....
Egypt                         1
China                         1
Name: country, dtype: int64
3.2 Maps 映射
3.2.1 map()
wine_points_mean = wine_rev.points.mean()wine_rev.points.map(lambda p : p-wine_points_mean),将数据变到均值上下(产生一个Series,原DF数据没变)
0        -1.447138
1        -1.447138
2        -1.447138
3        -1.447138
4        -1.447138
            ...
129966    1.552862
129967    1.552862
129968    1.552862
129969    1.552862
129970    1.552862
Name: points, Length: 129971, dtype: float64
3.2.2 apply()
通过定义函数,使用apply对整个表进行转换,对每一行进行操作
def remean_points(row):
    row.points = row.points - wine_points_mean
    return row
wine_rev.apply(remean_points,axis='columns')
Note that map() and apply() return new, transformed Series and DataFrames, respectively.
They don’t modify the original data they’re called on.
上面两种方法都不会修改原始数据
3.2.3 内置转换方法
wine_rev.points - wine_points_mean,直接相减就可以,每个数据都会减去右边的单个value
0        -1.447138
1        -1.447138
2        -1.447138
3        -1.447138
4        -1.447138
            ...
129966    1.552862
129967    1.552862
129968    1.552862
129969    1.552862
129970    1.552862
Name: points, Length: 129971, dtype: float64
wine_rev.country + '-' + wine_rev.region_1,相等长度的两个Series操作,直接1v1对应起来
0                     Italy-Etna
1                            NaN
2           US-Willamette Valley
3         US-Lake Michigan Shore
4           US-Willamette Valley
                   ...
129966                       NaN
129967                 US-Oregon
129968             France-Alsace
129969             France-Alsace
129970             France-Alsace
Length: 129971, dtype: object
4. Grouping and Sorting
4.1 Grouping 分组
4.1.1 groupby()
wine_rev.groupby('points').points.count()
points
80       397
81       692
82      1836
83      3025
84      6480
85      9530
86     12600
87     16933
88     17207
89     12226
90     15410
91     11359
92      9613
93      6489
94      3758
95      1535
96       523
97       229
98        77
99        33
100       19
Name: points, dtype: int64
wine_rev.groupby('points').price.min(),按得分分组,然后每组里面价格最低的
points
80      5.0
81      5.0
82      4.0
83      4.0
84      4.0
85      4.0
86      4.0
87      5.0
88      6.0
89      7.0
90      8.0
91      7.0
92     11.0
93     12.0
94     13.0
95     20.0
96     20.0
97     35.0
98     50.0
99     44.0
100    80.0
Name: price, dtype: float64
wine_rev.groupby('points').apply(lambda df : df.title.iloc[0]),按得分分组后,每个DataFrame的 title的第一行,代码产生的是一个Series
points
80     Viña Tarapacá 2015 Gran Reserva Chardonnay (Le...
81     Pura 8 2010 Grand Reserve Pinot Noir (Rapel Va...
82       Mémoires 2015 Rosé (Coteaux Varois en Provence)
83         Koyle 2015 Costa Pinot Noir (Colchagua Costa)
84     Three Brothers 2014 Zero Degree Dry Riesling (...
85     Casa Silva 2008 Gran Reserva Petit Verdot (Col...
86     Clarksburg Wine Company 2010 Chenin Blanc (Cla...
87                     Nicosia 2013 Vulkà Bianco  (Etna)
88                  Fattoria Sardi 2015 Rosato (Toscana)
89           David Fulton 2008 Petite Sirah (St. Helena)
90     Beaumont 2005 Hope Marguerite Chenin Blanc (Wa...
91     Le Riche 2003 Cabernet Sauvignon Reserve Caber...
92     Dopff & Irion 2004 Schoenenbourg Grand Cru Ven...
93     Claiborne & Churchill 2014 Twin Creeks Estate ...
94         Sandeman 2015 Quinta do Seixo Vintage  (Port)
95     Jasper Hill 2013 Georgia's Paddock Shiraz (Hea...
96                        Oremus 2005 Eszencia  (Tokaji)
97     Robert Weil 2014 Kiedrich Gräfenberg Trockenbe...
98     Chambers Rosewood Vineyards NV Rare Muscadelle...
99     Quilceda Creek 2008 Cabernet Sauvignon (Columb...
100    Chambers Rosewood Vineyards NV Rare Muscat (Ru...
dtype: object
wine_rev.groupby(['country','province']).apply(lambda df : df.loc[df.points.idxmax()])
按照,先按国家分组、再按省份分组,每个组里得分最大的,产生的是一个DataFrame
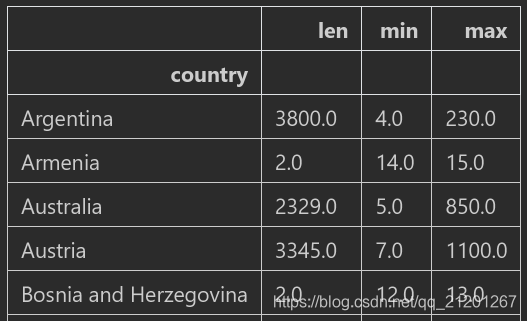
4.1.2 agg()
wine_rev.groupby(['country']).price.agg([len,min,max]),后面可以跟一些统计量
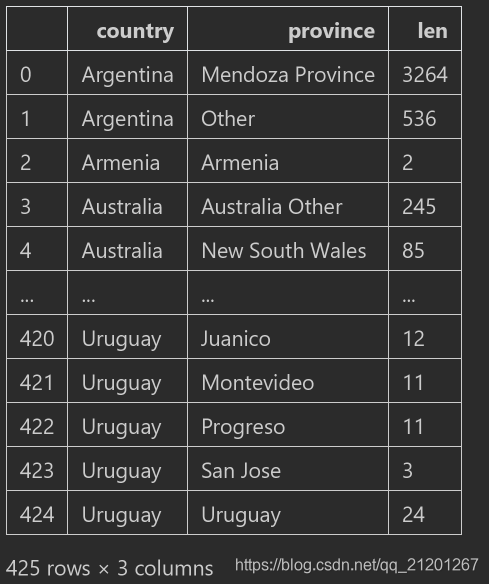
4.1.3 multi_indexes
country_rev = wine_rev.groupby(['country','province']).description.agg([len]),多个特征的分组是多索引的

country_rev.index,MultiIndex 多级索引
MultiIndex([('Argentina',  'Mendoza Province'),
            ('Argentina',             'Other'),
            (  'Armenia',           'Armenia'),
            ('Australia',   'Australia Other'),
            ('Australia',   'New South Wales'),
            ('Australia',   'South Australia'),
            ('Australia',          'Tasmania'),
            ('Australia',          'Victoria'),
            ('Australia', 'Western Australia'),
            (  'Austria',           'Austria'),
            ...
            (       'US',        'Washington'),
            (       'US', 'Washington-Oregon'),
            (  'Ukraine',           'Ukraine'),
            (  'Uruguay',         'Atlantida'),
            (  'Uruguay',         'Canelones'),
            (  'Uruguay',           'Juanico'),
            (  'Uruguay',        'Montevideo'),
            (  'Uruguay',          'Progreso'),
            (  'Uruguay',          'San Jose'),
            (  'Uruguay',           'Uruguay')],
           names=['country', 'province'], length=425)
- 转换多级索引为普通索引,
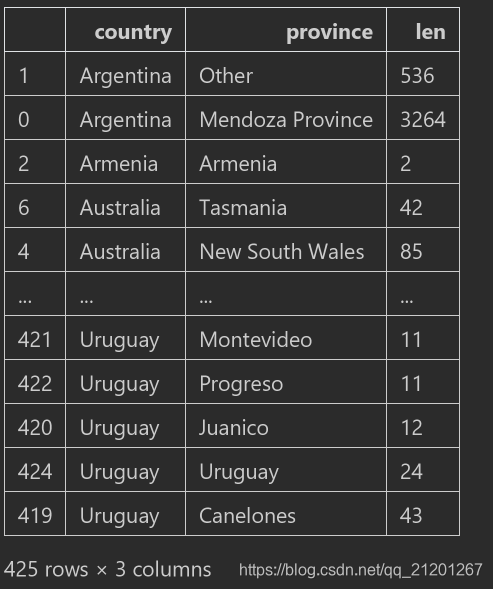
cr = country_rev.reset_index(),需赋值给一个新的DF

4.2 sort_values() 排序
上面例子可以看出,输出都是按照 index 排序的,我们有时希望按值排序。
cr.sort_values(by='len'),默认升序
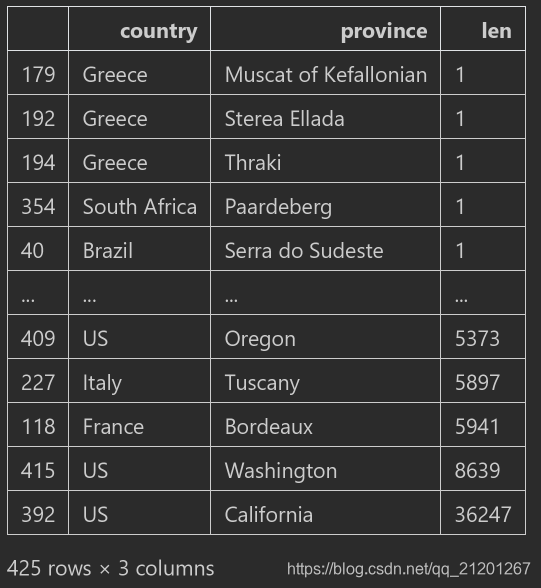
cr.sort_values(by='len',ascending=False),降序(升序=False)cr.sort_index(),恢复按 index 升序
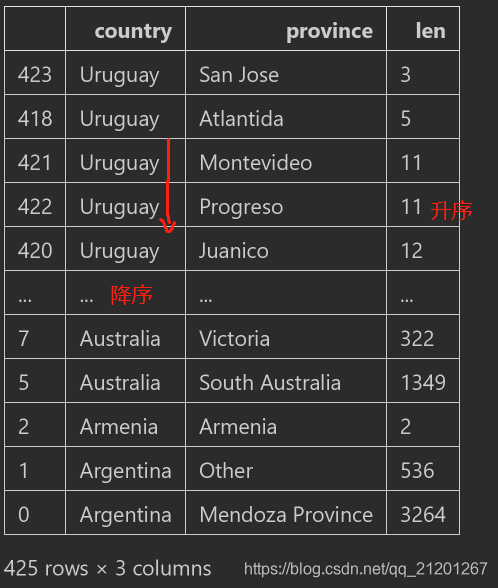
- 按多个值进行排序,
cr.sort_values(by=['country', 'len']),先按国家字符串升序,然后按长度升序
cr.sort_values(by=['country', 'len'],ascending=[False,True]),还可分别指定,每个特征是升序还是降序
上一篇:Pandas入门1(DataFrame+Series读写/Index+Select+Assign)
下一篇:Pandas入门3(dtype+fillna+replace+rename+concat+join)