一,安装echarts之后创建echarts组件
二,用 option 描述图表
echarts 的使用者,使用 option 来描述其对图表的各种需求,包括:有什么数据、要画什么图表、图表长什么样子、含有什么组件、组件能操作什么事情等等。简而言之,option 表述了:数据、数据如何映射成图形、交互行为。
三,实际例子
<template>
    <div class="revenueBox">
        <div class="container">
            <el-radio-group v-model="rangeRadio" size="small">
                <el-radio-button label="1">当日</el-radio-button>
                <el-radio-button label="2">近7天</el-radio-button>
                <el-radio-button label="3">近30天</el-radio-button>
            </el-radio-group>
            <!-- 时间范围选择 -->
            <el-date-picker type="datetime" placeholder="开始时间" v-model="startTime" class="w170 ml20"></el-date-picker>
            <span class="tace ml10 cogr">--</span>
            <el-date-picker type="datetime" placeholder="结束时间" v-model="endTime" class="w170 ml10"></el-date-picker>
            <el-button size="small" class="ml20" type="primary" @click="certain">确定</el-button>
        </div>
        <!-- 总体营业指标 -->
        <div class="container mt20 echartsBox">
            <div class="title">
                <div class="chart-title">总体营业指标</div>
            </div>
            <div class="chart-area ml40">
                <echarts :chartData="option1" :width="'40%'" :class="'leftEchart'"></echarts>
                <span class="middle-span"></span>
                <echarts :chartData="option2" :width="'40%'" :class="'rightEchart'"></echarts>
            </div>
        </div>

        <div class="tableBox">
            <!-- 店内收款占比 -->
            <div class="container mt20 echartsBox">
                <div class="title">
                    <div class="chart-title">店内收款占比</div>
                </div>
                <div class="chart-area ml40">
                    <echarts :chartData="option2" :width="'100%'" ></echarts>
                </div>
            </div>
            <div class="middle-span2"></div>
            <!-- 外卖收款占比 -->
            <div class="container mt20 echartsBox secondechart">
                <div class="title">
                    <div class="chart-title">外卖收款占比</div>
                </div>
                <div class="chart-area ml40">
                    <echarts :chartData="option2" :width="'100%'" ></echarts>
                </div>
            </div>
        </div>

    </div>
</template>

<script>
import Echarts from '@/components/echarts';
export default {


    components:{


        Echarts,
    },
    name: "revenueMain",
    data() {


        return {


            rangeRadio:'2',
            startTime:'',
            endTime:'',
            option1: {


                // title: {


                //     text: '某站点用户访问来源',
                //     subtext: '纯属虚构',
                //     left: 'center'
                // },
                tooltip: {


                    trigger: 'item'
                },
                legend: {


                    orient: 'vertical',
                    top:'30%',      //距离顶部位置
                    right: 0,  //右侧显示
                    show:true,   //控制是否显示
                    // itemWidth:15,
                    // itemHeight:15,  //控制icon的宽度和高度
                    icon:'circle'   //把icon设置为圆形
                },
                series: [
                    {


                        name: '访问来源',
                        type: 'pie',
                        radius: ['40%', '70%'],
                        avoidLabelOverlap: false,
                        labelLine: {


                            show: true
                        },
                        label: {


                            formatter: '{b}: {d}%'
                        },
                        data: [
                            {

    value: 1000, name: '外卖收款'},
                            {

    value: 1000, name: '店内收款'}
                        ],
                        emphasis: {


                            itemStyle: {


                                shadowBlur: 10,
                                shadowOffsetX: 0,
                                shadowColor: 'rgba(0, 0, 0, 0.5)'
                            }
                        }
                    }
                ]
            },
            option2: {


                tooltip: {


                    trigger: 'item'
                },
                legend: {


                    orient: 'vertical',
                    right: 0,
                    top: 'center',
                },
                series: [
                    {


                        name: '访问来源',
                        type: 'pie',
                        radius: ['40%', '70%'],
                        avoidLabelOverlap: false,
                        labelLine: {


                            show: true
                        },
                        data: [
                            {

    value: 1048, name: '搜索引擎'},
                            {

    value: 735, name: '直接访问'},
                            {

    value: 580, name: '邮件营销'},
                            {

    value: 484, name: '联盟广告'},
                            {

    value: 300, name: '视频广告'}
                        ],
                        emphasis: {


                            itemStyle: {


                                shadowBlur: 10,
                                shadowOffsetX: 0,
                                shadowColor: 'rgba(0, 0, 0, 0.5)'
                            }
                        }
                    }
                ]
            }
        }
    },
    methods:{


        //发起请求,获取收款构成的数据
        async getCollections(){


            console.log(this.startTime)
            var params={


                dateType:this.rangeRadio,
                startT:this.startTime,
                endT:this.endTime
            }
            try{


                var res = await this.$http.get('api/analyze/makeCollectionsIndex',params);
            }catch(err){


                console.log("报错了:",err)
            }
            console.log(res)

        },
        certain(){


            this.getCollections()
        }
    },
    created(){


        this.getCollections()
    }
}
</script>

<!-- Add "scoped" attribute to limit CSS to this component only -->
<style lang="less" scoped>
.container{


    background: #FFFFFF;
    padding: 25px 24px;
}
.revenueBox .echartsBox{


    padding: 0 ;
    .title{


        background: #D2E0FC;
        height: 60px;
        display: flex;
        align-items: center;
        .chart-title{


            border-left: 2px solid #4F7BCA;
            padding-left: 6px;
            color: #333333;
            font-size: 16px;
            font-weight: bold;
        }
    }
    .chart-area{


        width: calc(100% - 80px);
        height: 550px;
        padding: 20px 30px;
        box-sizing: border-box;
        // box-shadow: 0 2px 13px 0 rgba(75, 75, 75, 0.23);
        display: flex;
        align-items: center;
        justify-content: center;
        .middle-span{


            width: 2px;
            height: 180px;
            background: #E9E8E8;
            margin: 0 120px;
        }
    }
}
.tableBox{


    display: flex;
    width: 100%;
    .echartsBox{


        width: 100%;
    }
    .middle-span2{


        width: 20px;
    }
}
.dyic{

    display: block;}
.w170{

    width: 170px;}
.ml20{

    margin-left: 20px;}
.cogr{

    color:#E9E8E8;}
.lh42{

    line-height: 42px;}
</style>
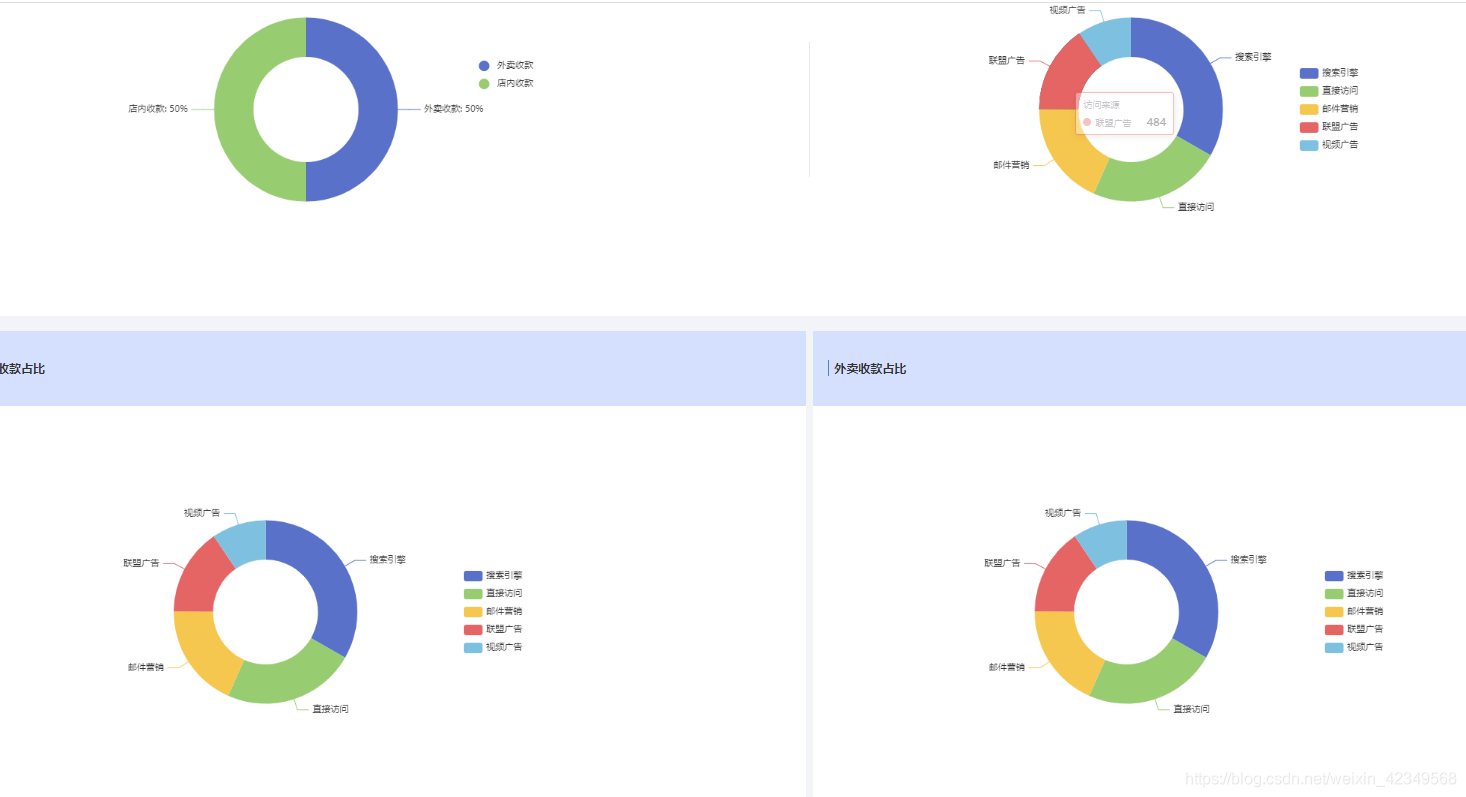
实现的效果:
四,参看配置文档
其实,常用的使用场景,都已经内置了配置项,在这个网站上都可以找到对应的配置数据:
https://echarts.apache.org/zh/option.html#series-pie