Item
在QCustomPlot中,所有的Item都继承自QCPAbstractItem,QCustomPlot给我们提供了一些Item
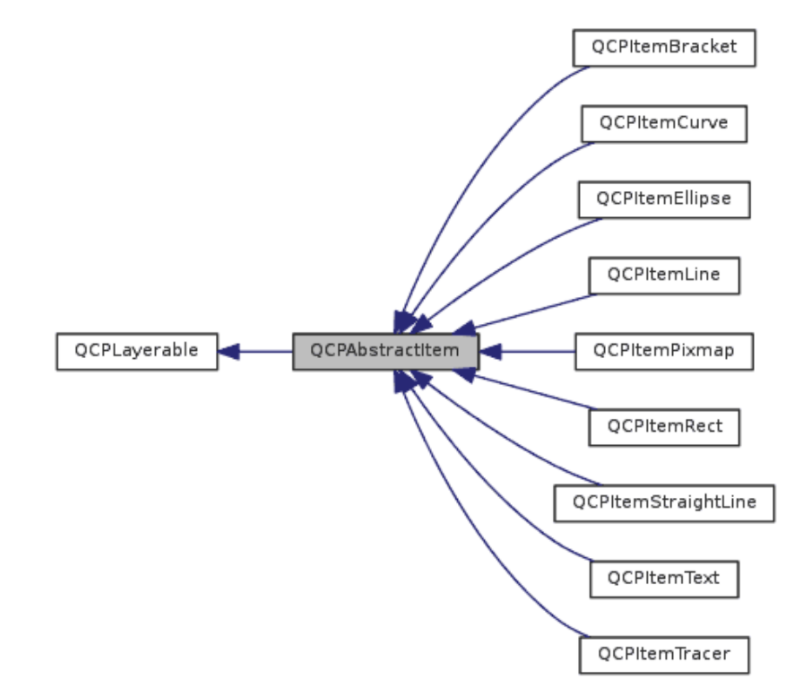
| item | 说明 |
|---|---|
| QCPItemBracket | 括号Item |
| QCPItemCurve | 曲线Item,其实就是贝塞尔曲线 |
| QCPItemEllipse | 椭圆/圆Item |
| QCPItemLine | 线段Item |
| QCPItemPixmap | 图片Item |
| QCPItemRect | 矩形Item |
| QCPItemStraightLine | 直线Item |
| QCPItemText | 文字Item |
| QCPItemTracer | 追踪者Item |
QCPAbstractItem 默认存在于QCustomPlot的当前层中,默认的当前层为main,我们可以通过setClipToAxisRect和setClipAxisRect设置Item位于某个特定的轴矩形,将setClipToAxisRect设置为false则Item位于QCustomPlot
QCPItemAnchor与QCPItemPosition联系与区别
- QCPItemPosition继承自QCPItemAnchor
- QCPItemAnchor用于给QCPItemPosition定位用的
- QCPItemPosition则表示了Item的位置
- 一个Item可以有多个QCPItemAnchor和QCPItemPosition
我们主要理解QCPItemPosition是如何决定Item的位置的,它有四种位置类型:
ptAbsolute 按像素的方式
ptViewportRatio 按QCustomPlot可视区域的比例
ptAxisRectRatio 按其存在的轴矩形的比例(通过setAxisRect函数设置轴矩形)
ptPlotCoords 按坐标系位置(通过setAxes函数轴)
- 可以通过setType、setTypeX、setTypeY函数设置x、y方向的位置类型,
- 通过setCoords设置其位置,setCoords是跟setType设置的类型相关的( 绝对位置 相对位置 )
- Item的位置还跟它锚定的父锚点QCPItemAnchor相关,可以通过setParentAnchor、setParentAnchorX、setParentAnchorY函数设置x、y方向的父锚点
bool QCPItemPosition::setParentAnchor(QCPItemAnchor *parentAnchor, bool keepPixelPosition)
bool QCPItemPosition::setParentAnchorX(QCPItemAnchor *parentAnchor, bool keepPixelPosition)
bool QCPItemPosition::setParentAnchorY(QCPItemAnchor *parentAnchor, bool keepPixelPosition)
- 父锚点决定了其起点位置,当设置父锚点后,type类型会变为ptAbsolute按绝对按像素的方式
- 我们可以直接通过setPixelPosition设置Item的像素位置,而不用管setType的类型是什么,通过pixelPosition返回Item的像素位置
QCPItemBracket 括号item
QCPItemBracket有四种类型:
- bsSquare 中括号
- bsRound 小括号
- bsCurly 大括号
- bsCalligraphic 实体大括号
通过left和right决定其位置,而center则用于给其它的QCPItemPosition定位用的
//  添加了一个括号item
  QCPItemBracket *bracket = new QCPItemBracket(customPlot);
  //设置一个起始点
  bracket->left->setCoords(3, 1.1);
//  设置一个中止点
  bracket->right->setCoords(13, 1.1);
//  设置括号长度
  bracket->setLength(10);
//  设置括号样式
  bracket->setStyle(QCPItemBracket::BracketStyle::bsRound);
QCPItemText
- 文字item有一个文字矩行
- plot有1个view矩形
- 1个Plot坐标轴矩形
QCPItemText由position决定其位置,但是position不一定是在文字中心的位置,我们可以通过setPositionAlignment设置position对齐在文字矩形的哪一个地方
//添加1个txt的item   add the text label at the top:
  QCPItemText *wavePacketText = new QCPItemText(customPlot);
//  设置父锚点,定位点
  wavePacketText->position->setParentAnchor(bracket->center);
//  设置相对父锚点坐标
  wavePacketText->position->setCoords(0, 1); // move 10 pixels to the top from bracket center anchor
//  设置txt的相对位置
  wavePacketText->setPositionAlignment(Qt::AlignBottom|Qt::AlignHCenter);
  //
  wavePacketText->setText("Wavepacket");
  //设置字体和大小
  wavePacketText->setFont(QFont(font().family(), 10));
QCPItemTracer
它主要用来跟踪QCPGraph的某个数据点,QCPItemTracer也是用一个position来决定其位置
实时跟踪的原理就是在定时器不断的设置key值
QCPItemTracer有五种风格
tsNone 不显示tracer
tsPlus 加号
tsCrosshair 十字线,横跨整个轴矩形
tsCircle 圆
tsSquare 方块
- QCPItemTracer通过函数setGraph和setGraphKey设置要跟踪的图表以及数据点,
- setGraph(nullptr)可以使QCPItemTracer得位置是任意的。
- QCPItemTracer的位置还跟setInterpolating函数有关,当setInterpolating为true时,启用线性插值,这时候QCPItemTracer的位置是精确地在我们设置的位置,并且对value轴的值进行线性插值;为false的时候QCPItemTracer的位置是最接近于这个位置的key值点的位置,就是自动获取value
效果图

void MainWindow::setupSimpleItemDemo(QCustomPlot *customPlot)
{


  demoName = "Simple Item Demo";
  customPlot->setInteractions(QCP::iRangeDrag | QCP::iRangeZoom);

  // add the text label at the top:
  QCPItemText *textLabel = new QCPItemText(customPlot);
  textLabel->setPositionAlignment(Qt::AlignTop | Qt::AlignHCenter);

  textLabel->position->setType(QCPItemPosition::ptAxisRectRatio);
  textLabel->position->setCoords(0.5, 0); // place position at center/top of axis rect
  textLabel->setText("Text Item Demo");
  textLabel->setFont(QFont(font().family(), 16)); // make font a bit larger
  textLabel->setPen(QPen(Qt::black));             // show black border around text

  // add the arrow:
  QCPItemLine *arrow = new QCPItemLine(customPlot);
  arrow->start->setParentAnchor(textLabel->bottom);
  arrow->end->setCoords(4, 1.6); // point to (4, 1.6) in x-y-plot coordinates
  //设置head为一个箭头
  arrow->setHead(QCPLineEnding::esSpikeArrow);
}

void MainWindow::setupItemDemo(QCustomPlot *customPlot)
{


  demoName = "Item Demo";
  //  可以缩放和拖动
  customPlot->setInteractions(QCP::iRangeDrag | QCP::iRangeZoom);

  QCPGraph *graph = customPlot->addGraph();
  int n = 200;
  double phase = 0;
  double k = 3;
  QVector<double> x(n), y(n);
  for (int i = 0; i < n; ++i)
  {


    //    x[i] = i/(double)(n-1)*34 - 17;
    //    y[i] = qExp(-x[i]*x[i]/20.0)*qSin(k*x[i]+phase);
    x[i] = i * 0.1;
    y[i] = qSin(x[i] * 3.15);
  }
  graph->setData(x, y);
  graph->setPen(QPen(Qt::blue));
  graph->rescaleKeyAxis();
  customPlot->yAxis->setRange(-1.45, 1.65);
  customPlot->xAxis->grid()->setZeroLinePen(Qt::NoPen);

  // add the bracket at the top:
  //  添加了一个括号item
  QCPItemBracket *bracket = new QCPItemBracket(customPlot);
  //设置一个起始点
  bracket->left->setCoords(3, 1.1);
  //  设置一个中止点
  bracket->right->setCoords(13, 1.1);
  //  设置括号长度
  bracket->setLength(10);
  //  设置括号样式
  bracket->setStyle(QCPItemBracket::BracketStyle::bsRound);

  //添加1个txt的item   add the text label at the top:
  QCPItemText *wavePacketText = new QCPItemText(customPlot);
  //  设置父锚点,定位点
  wavePacketText->position->setParentAnchor(bracket->center);
  //  设置相对父锚点坐标
  wavePacketText->position->setCoords(0, 1); // move 10 pixels to the top from bracket center anchor
                                             //  设置txt的相对位置
  wavePacketText->setPositionAlignment(Qt::AlignBottom | Qt::AlignHCenter);
  wavePacketText->setText("Wavepacket");
  wavePacketText->setFont(QFont(font().family(), 10));

  // add the phase tracer (red circle) which sticks to the graph data (and gets updated in bracketDataSlot by timer event):
  QCPItemTracer *phaseTracer = new QCPItemTracer(customPlot);
  itemDemoPhaseTracer = phaseTracer; // so we can access it later in the bracketDataSlot for animation
                                     //  设置待跟踪的graph
  phaseTracer->setGraph(graph);
  //  待跟踪的key
  phaseTracer->setGraphKey(M_PI);
  //  启用插值跟踪,也就是自动计算value
  phaseTracer->setInterpolating(true);
  //  设置跟踪点样式
  //  phaseTracer->setStyle(QCPItemTracer::tsCircle);
  phaseTracer->setStyle(QCPItemTracer::tsSquare);
  //  设置跟踪点的颜色
  phaseTracer->setPen(QPen(Qt::red));
  //  设置跟踪点的颜色
  phaseTracer->setBrush(Qt::red);
  phaseTracer->setSize(10);
  phaseTracer->setClipAxisRect(customPlot->axisRect());
  //  phaseTracer->
  //   phaseTracer->position->setType(QCPItemPosition::PositionType::ptPlotCoords);
  //  phaseTracer->position->setCoords(15 ,5);

  //  phaseTracer->setClipAxisRect()

  // add label for phase tracer:
  QCPItemText *phaseTracerText = new QCPItemText(customPlot);
  //设置左边点的参考方式
  phaseTracerText->position->setType(QCPItemPosition::ptAxisRectRatio);
  //  设置文字矩形相对于轴矩形或参考矩的位置
  phaseTracerText->setPositionAlignment(Qt::AlignRight | Qt::AlignBottom);
  //  文字矩形相对于参考矩形的位置
  phaseTracerText->position->setCoords(1, 0.9); // lower right corner of axis rect
  phaseTracerText->setText("Points of fixed\nphase define\nphase velocity vp");
  //   设置txt在文字矩形内的对齐方式
  phaseTracerText->setTextAlignment(Qt::AlignRight);
  //  文字的字体设置
  phaseTracerText->setFont(QFont(font().family(), 9));
  phaseTracerText->setPadding(QMargins(5, 5, 5, 5));

  //文字矩行背景
  phaseTracerText->setBrush(QColor(200, 80, 80, 100));
  //轴矩形背景色设置
  customPlot->axisRect()->setBackground(QColor(0, 100, 180, 200));
  //设置plot view 的矩形框背景色
  customPlot->setBackground(QColor(100, 200, 180));

  /*
   * 三阶贝塞尔曲线 QCPItemCurve  https://www.jianshu.com/p/0c9b4b681724
    start  曲线的起始点
    end    曲线的结束点
    startDir 控制曲线的曲率点1
    endDir  控制曲线曲率的点2

    */
  // 创建一个指向追踪器的箭头 add arrow pointing at phase tracer, coming from label:
  QCPItemCurve *phaseTracerArrow = new QCPItemCurve(customPlot);
  phaseTracerArrow->start->setParentAnchor(phaseTracerText->left);
  phaseTracerArrow->startDir->setParentAnchor(phaseTracerArrow->start);
  phaseTracerArrow->startDir->setCoords(-80, 0); // direction 30 pixels to the left of parent anchor (tracerArrow->start)
  //结束点始终追踪Tracer 实现动态追踪的效果
  phaseTracerArrow->end->setParentAnchor(phaseTracer->position);
  phaseTracerArrow->end->setCoords(10, 10);
  phaseTracerArrow->endDir->setParentAnchor(phaseTracerArrow->end);
  phaseTracerArrow->endDir->setCoords(120, 80);
  //  设置结束点形状
  phaseTracerArrow->setHead(QCPLineEnding::esSpikeArrow);
  //  QCPLineEnding(EndingStyle style, double width=8, double length=10, bool inverted=false);
  //  设置贝塞尔曲线的首 尾形状
  phaseTracerArrow->setTail(QCPLineEnding(QCPLineEnding::esBar, phaseTracerText->bottom->pixelPosition().y() - phaseTracerText->top->pixelPosition().y()));

  /******************************************************************************************************************/
  //创建一个跟踪器 add the group velocity tracer (green circle):
  QCPItemTracer *groupTracer = new QCPItemTracer(customPlot);
  groupTracer->setGraph(graph);
  groupTracer->setGraphKey(5.5);
  //  启用插值跟踪,也就是自动计算value
  groupTracer->setInterpolating(true);
  //  设置跟踪器的形状
  groupTracer->setStyle(QCPItemTracer::tsCircle);
  //  设置跟踪器的轮廓颜色
  groupTracer->setPen(QPen(Qt::red));
  //  设置跟踪器的填充颜色
  groupTracer->setBrush(Qt::green);
  //  设置跟踪器的大小
  groupTracer->setSize(15);

  //创建一个文本的item  add label for group tracer:
  QCPItemText *groupTracerText = new QCPItemText(customPlot);
//  设置文本的位置坐标的参考取值方式,相对于坐标轴矩形
  groupTracerText->position->setType(QCPItemPosition::ptAxisRectRatio);
//  文本矩形相对于plot矩形的位置
  groupTracerText->setPositionAlignment(Qt::AlignRight | Qt::AlignTop);
  //具体相对于plot矩形的位置,设置位置系数
  groupTracerText->position->setCoords(1, 0.01); // lower right corner of axis rect
//  设置内容
  groupTracerText->setText("Fixed positions in\nwave packet define\ngroup velocity vg");
//  设置相对于TXT矩形内的文字排列方式
  groupTracerText->setTextAlignment(Qt::AlignLeft);
//  设置字体和大小
  groupTracerText->setFont(QFont(font().family(), 9));
//设置 相对于txt矩形边框的间距
  groupTracerText->setPadding(QMargins(10, 0, 0, 0));

  // add arrow pointing at group tracer, coming from label:
  QCPItemCurve *groupTracerArrow = new QCPItemCurve(customPlot);

  groupTracerArrow->start->setParentAnchor(groupTracerText->left);
  groupTracerArrow->startDir->setParentAnchor(groupTracerArrow->start);
//  设置相对于父锚点的绝对像素位置
  groupTracerArrow->startDir->setCoords(-50, 100); // direction 30 pixels to the left of parent anchor (tracerArrow->start)
  groupTracerArrow->endDir->setParentAnchor(groupTracer->position);
  groupTracerArrow->endDir->setCoords(50, -200);
  groupTracerArrow->end->setParentAnchor(groupTracer->position);
  groupTracerArrow->end->setCoords(5, -10);

  groupTracerArrow->setHead(QCPLineEnding::esSpikeArrow);
  groupTracerArrow->setTail(QCPLineEnding(QCPLineEnding::esBar, (groupTracerText->bottom->pixelPosition().y() - groupTracerText->top->pixelPosition().y()) * 0.85));

  // add dispersion arrow:
  QCPItemCurve *arrow = new QCPItemCurve(customPlot);
  arrow->start->setCoords(1, 1);
  arrow->startDir->setCoords(1.2, 1.3);
  arrow->endDir->setCoords(5, 0.3);
  arrow->end->setCoords(10, 0.5);
  arrow->setHead(QCPLineEnding::esSpikeArrow);
  arrow->setPen(QPen(Qt::blue));

  // add the dispersion arrow label:
  QCPItemText *dispersionText = new QCPItemText(customPlot);
  dispersionText->position->setType(QCPItemPosition::PositionType::ptAxisRectRatio);
  dispersionText->position->setCoords(0.15, 0.15);
  dispersionText->setTextAlignment(Qt::AlignLeft);
  dispersionText->setRotation(10);
  dispersionText->setText("Dispersion with\nvp < vg");
  dispersionText->setFont(QFont(font().family(), 10));

  // setup a timer that repeatedly calls MainWindow::bracketDataSlot:
//  使用定时器不点切换key值实现动态跟踪效果
  connect(&dataTimer, SIGNAL(timeout()), this, SLOT(bracketDataSlot()));
  dataTimer.start(0); // Interval 0 means to refresh as fast as possible
}
动态切换效果
void MainWindow::realtimeDataSlot()
{


  static QTime timeStart = QTime::currentTime();
  // calculate two new data points:
  double key = timeStart.msecsTo(QTime::currentTime()) / 1000.0; // time elapsed since start of demo, in seconds
  static double lastPointKey = 0;
  if (key - lastPointKey > 0.002) // at most add point every 2 ms
  {


    // add data to lines:
    //      定时器循环添加数据
    ui->customPlot->graph(0)->addData(key, qSin(key) + std::rand() / (double)RAND_MAX * 1 * qSin(key / 0.3843));
    ui->customPlot->graph(1)->addData(key, qCos(key) + std::rand() / (double)RAND_MAX * 0.5 * qSin(key / 0.4364));
    // rescale value (vertical) axis to fit the current data:
    //ui->customPlot->graph(0)->rescaleValueAxis();
    //ui->customPlot->graph(1)->rescaleValueAxis(true);
    lastPointKey = key;
  }
  // make key axis range scroll with the data (at a constant range size of 8):
  //  自动更新坐标轴范围保证只是显示一部分内容
  ui->customPlot->xAxis->setRange(key, 8, Qt::AlignRight);
  //   ui->customPlot->rescaleAxes();
  ui->customPlot->replot();

  // calculate frames per second:
  //  状态栏更新统计数据
  static double lastFpsKey;
  static int frameCount;
  ++frameCount;
  if (key - lastFpsKey > 2) // average fps over 2 seconds
  {


    ui->statusBar->showMessage(
        QString("%1 FPS, Total Data points: %2")
            .arg(frameCount / (key - lastFpsKey), 0, 'f', 0)
            .arg(ui->customPlot->graph(0)->data()->size() + ui->customPlot->graph(1)->data()->size()),
        0);
    lastFpsKey = key;
    frameCount = 0;
  }
}