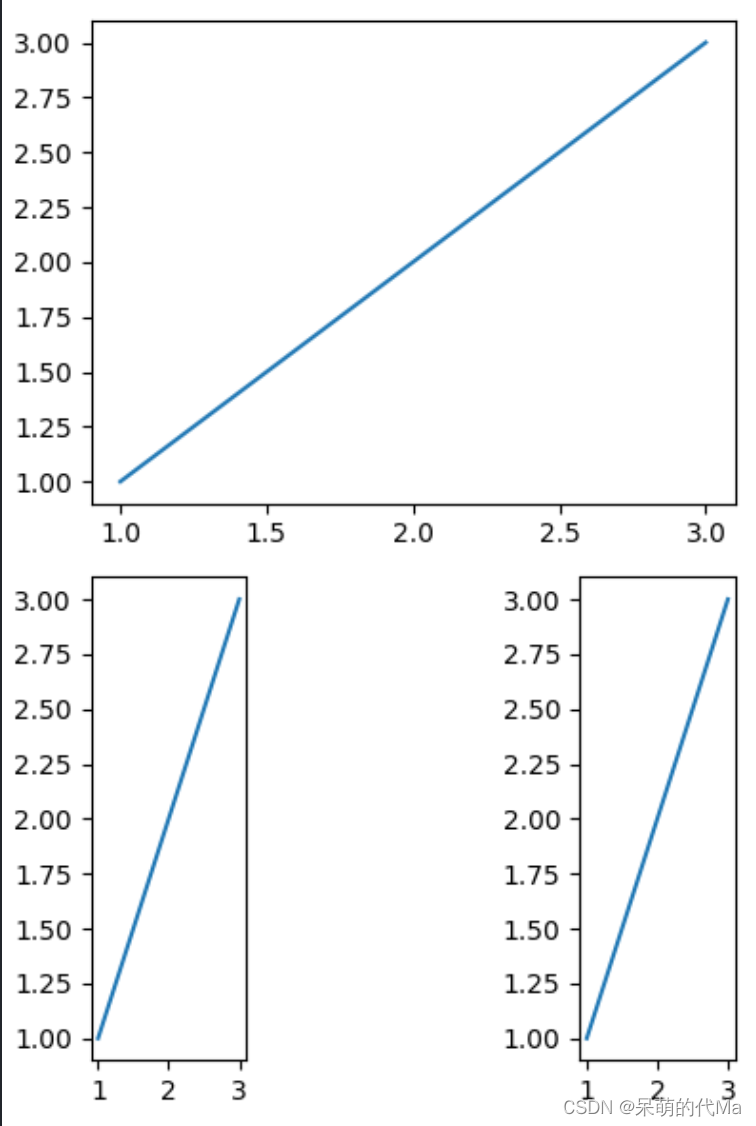
不设置子图时,默认Figure只有一个Axies,设置子图就是在一个Figure里包含多个Axes,示例如下:

示例代码
import matplotlib.gridspec as gridspec  # 用网格来创建子图
import matplotlib.pyplot as plt

fig = plt.figure(figsize=(4, 6))  # 创建画布
grid = gridspec.GridSpec(2, 3)  # 设定2行*3列的网格

ax1 = fig.add_subplot(grid[0, :])  # 第一行的全部列都添加到ax1中
ax1.plot([1, 2, 3], [1, 2, 3])  # 在ax1中绘图与操作,这都是这个ax的操作,不会影响全局

ax2 = fig.add_subplot(grid[1, 0])  # 第二行,第1列
ax2.plot([1, 2, 3], [1, 2, 3])

ax3 = fig.add_subplot(grid[1, 2])  # 第二行,第3列
ax3.plot([1, 2, 3], [1, 2, 3])

fig.tight_layout()  # 全局整理图片尺寸

plt.show()
效果图如下: