from matplotlib import pyplot as plt
plt.rcParams.update({
'font.family': 'sans-serif',
'font.sans-serif': ['Times New Roman'],
})
losses= []
val_loss = []
with open('epoch_loss.txt', encoding='utf-8') as f:
for line in f:
line = line.strip('\n')
print(line)
losses.append(float(line))
num=len(losses)
iters = range(num)
with open('epoch_val_loss.txt', encoding='utf-8') as f:
for line in f:
line = line.strip('\n')
val_loss.append(float(line))
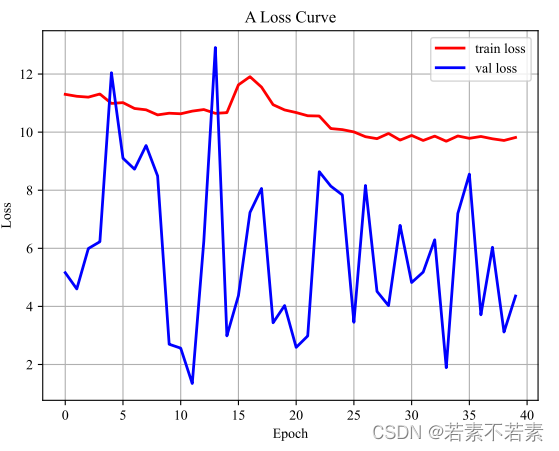
plt.figure()
plt.plot(iters, losses, 'red', linewidth=2, label='train loss')
plt.plot(iters, val_loss, 'blue', linewidth=2, label='val loss')
print(iters)
print(losses)
plt.grid(True)
plt.xlabel('Epoch')
plt.ylabel('Loss')
plt.title('A Loss Curve')
plt.legend(loc="upper right")
plt.savefig("epoch_loss.png")
plt.savefig( "epoch_loss.svg") #矢量图不失真
plt.cla()
plt.close("all")