前言
在3d可视化中,人们经常需要在节点中添加3D模型以增强节点的可视化效果。而3d-force-graph是一款流行的JavaScript库,可以用于创建基于力学系统的3D图形,并且它也支持向节点中添加3D模型。
在本文中,我们将演示如何使用3d-force-graph向节点中添加obj模型。
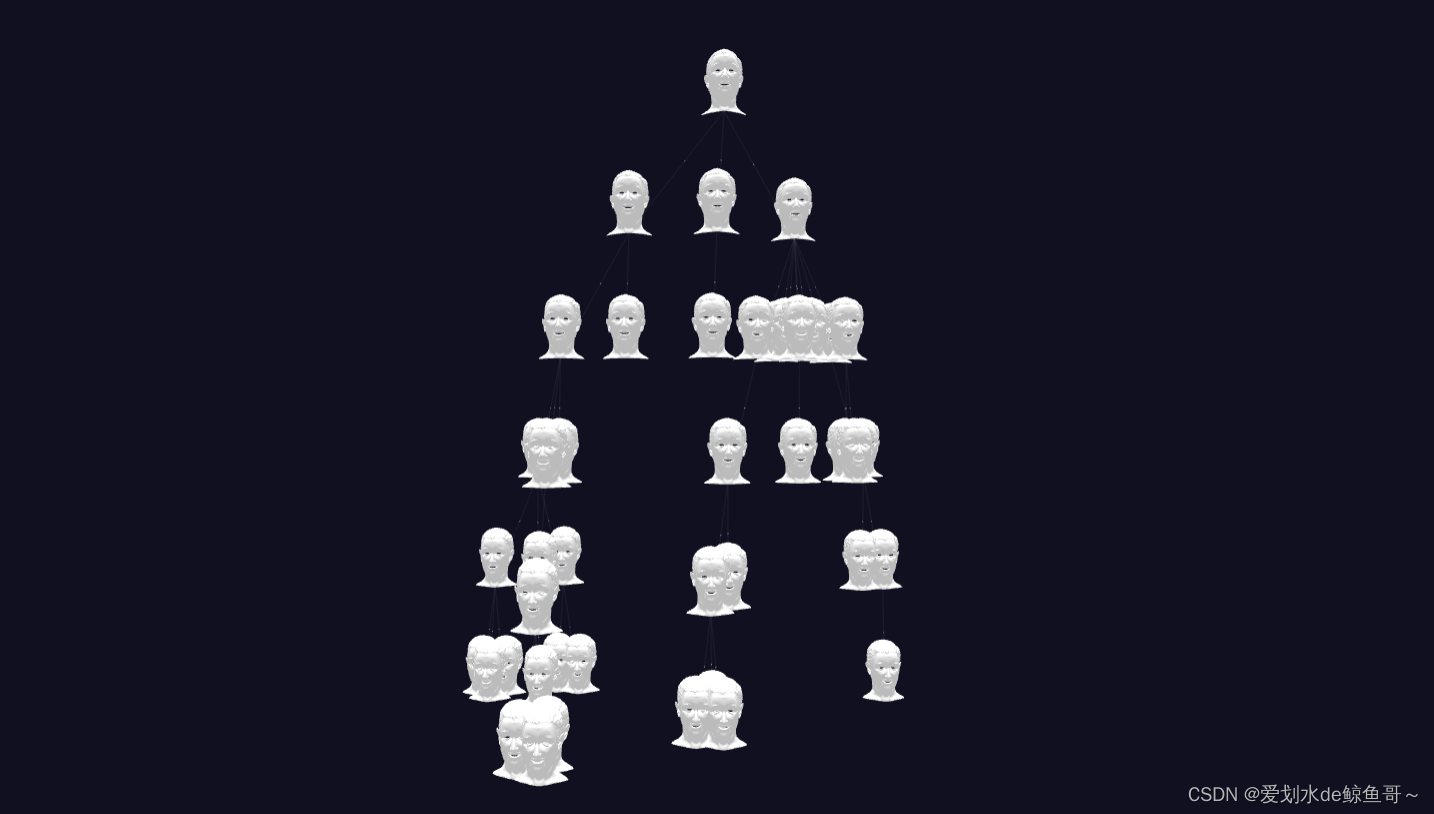
实现效果
实现步骤
加载OBJ模型
首先,我们需要编写一个函数来加载OBJ模型。这个函数将使用three.js中的OBJLoader来加载模型。
const obj = new THREE.Object3D();
const objLoader = new THREE.OBJLoader();
objLoader.load(node.objectUrl, function (object) {
	//设置模型缩放比例
	object.scale.set(0.1, 0.1, 0.1);
	obj.add(object);
});
添加节点数据
接下来,我们需要创建一个包含节点数据的JSON对象。每个节点对象都应该包含一个唯一的id以及一个指向其OBJ模型文件的url。例如:
        const graphData = {
            nodes: [
                { id: 'node1', objectUrl: 'http://127.0.0.1:5500/02.obj' },
                { id: 'node2', objectUrl: 'http://127.0.0.1:5500/02.obj' },
            ],
            links: [
                {source: "node1", target: "node2"}
            ]
        };
创建节点对象
在3d-force-graph中,我们可以使用nodeThreeObject(node => {…})方法来自定义每个节点的3D对象。在这个函数里,我们将加载OBJ模型,并将其添加到一个THREE.Object3D对象中。
        const graph3d = ForceGraph3D()(document.getElementById('3d-graph'))
            .graphData(graphData)
            .nodeThreeObject(node => {
                const obj = new THREE.Object3D();
                const objLoader = new THREE.OBJLoader();
                objLoader.load(node.objectUrl, function (object) {
                    //设置模型缩放比例
                    object.scale.set(0.1, 0.1, 0.1);
                    obj.add(object);
                });
                return obj
            })
            .linkColor(() => 'rgba(255,255,255,0.2)')
            .nodeLabel(node => `${node.id}`)
            .cooldownTicks(0);
在上面的示例代码中,我们创建了一个THREE.Object3D对象作为节点的3D对象,并加载OBJ模型。
完整代码
<!DOCTYPE html>
<html lang="en">
<head>
    <meta charset="UTF-8">
    <title>3d-force-graph加载obj模型</title>
    <script src="./js/three.min.js"></script>
    <script src="./js/OBJLoader.js"></script>
    <script src="./js/3d-force-graph.min.js"></script>
    <style>
        body {
            margin: 0;
            padding: 0;
        }

        #3d-graph {
            width: 100%;
            height: 100%;
            position: absolute;
        }
    </style>
</head>
<body>
    <div id="3d-graph"></div>

    <script>
        const graphData = {
            nodes: [
                { id: 'node1', objectUrl: 'http://127.0.0.1:5500/02.obj' },
                { id: 'node2', objectUrl: 'http://127.0.0.1:5500/02.obj' },
            ],
            links: [
                {source: "node1", target: "node2"}
            ]
        };

        const threeScene = new THREE.Scene();

        const graph3d = ForceGraph3D()(document.getElementById('3d-graph'))
            .graphData(graphData)
            .nodeThreeObject(node => {
                const obj = new THREE.Object3D();
                const objLoader = new THREE.OBJLoader();
                objLoader.load(node.objectUrl, function (object) {
                    //设置模型缩放比例
                    object.scale.set(0.1, 0.1, 0.1);
                    obj.add(object);
                });
                return obj
            })
            .linkColor(() => 'rgba(255,255,255,0.2)')
            .nodeLabel(node => `${node.id}`)
            .cooldownTicks(0);
    </script>
</body>
</html>