系列文章目录
提示:这里是该系列文章的所有文章的目录
第一章: (一)QCustomPlot常见属性设置、多曲线绘制、动态曲线绘制、生成游标、矩形放大等功能实现
第二章: (二)QCustomPlot生成热力图/矩阵颜色图
第三章: (三)Qt+QCustomPlot生成上下方向/不同颜色的条形图(柱形图)
第四章 :(四)QCustomPlot柱形图动态显示实例开发
文章目录
前言
本文主要讲述了Qt下使用QCustomPlot图形库实现条形图的绘制,示例实现了一个定制版的条形图,存在向上向下的条形,并且根据区间显示不同的颜色,示例代码见文章内容,大家可以参考学习,如有错误之处,欢迎大家批评指正。
项目效果
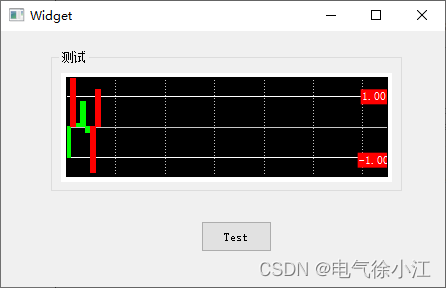
提示:以下是本篇文章正文内容,下面案例可供参考
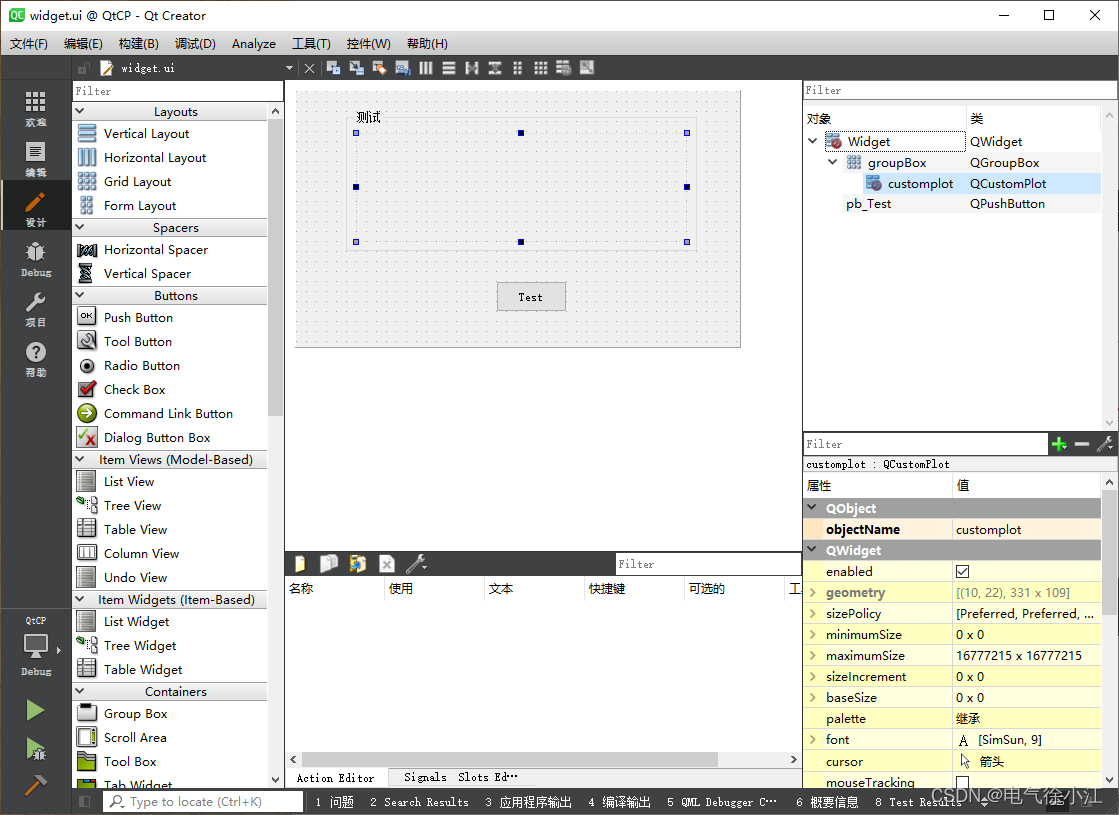
一、QCustomPlot的提升
这一步是在ui界面上添加了一个widget控件,并将其提升为QCustomPlot类,具体的提升步骤可见此博客:QCustomPlot常见属性设置、多曲线绘制、动态曲线绘制、生成游标、矩形放大等功能实现
二、绘制柱形图
这里将示例的完整代码进行展示,详情见代码注释
1.widget.h
#ifndef WIDGET_H
#define WIDGET_H

#include <QWidget>
#include "CustomPlot/qcustomplot.h"

QT_BEGIN_NAMESPACE
namespace Ui {

     class Widget; }
QT_END_NAMESPACE

class Widget : public QWidget
{


    Q_OBJECT

public:
    Widget(QWidget *parent = nullptr);
    ~Widget();

    void setBarCustomPlot(QCustomPlot *customPlot);

private slots:
    void on_pb_Test_clicked();

private:
    Ui::Widget *ui;

    QCustomPlot *m_customPlot;
    QCPItemText *maxLabel;
    QCPItemText *minLabel;
};
#endif // WIDGET_H
2.widget.cpp
#include "widget.h"
#include "ui_widget.h"

Widget::Widget(QWidget *parent)
    : QWidget(parent)
    , ui(new Ui::Widget)
{


    ui->setupUi(this);

}

Widget::~Widget()
{


    delete m_customPlot;
    delete ui;
}

void Widget::setBarCustomPlot(QCustomPlot *customPlot)
{


    //设置背景黑色
    customPlot->axisRect()->setBackground(QBrush(Qt::black));
    //customPlot->setInteractions(QCP::iRangeDrag | QCP::iRangeZoom);   //设置 可拖动,可放大缩小

    //x轴设置
    customPlot->xAxis->setVisible(true);
    customPlot->xAxis->setTickLabels(false);
    customPlot->xAxis->setSubTickLength(0);
    customPlot->xAxis->setTickLength(0);
    customPlot->xAxis->setRange(0,65);
    //customPlot->xAxis->setPadding(10);   //设置轴边距,默认最小为15,需要先修改源码qcustomplot.cpp(17598:setMinimumMargins)此处默认值
    //customPlot->xAxis->grid()->setVisible(false);   //设置网格是否显示
    //customPlot->xAxis->grid()->setPen(QPen(Qt::white));

    //x2轴设置
    customPlot->xAxis2->setVisible(true);
    customPlot->xAxis2->setTickLabels(false);
    customPlot->xAxis2->setSubTickLength(0);
    customPlot->xAxis2->setTickLength(0);

    //y轴设置
    customPlot->yAxis->setVisible(true);
    customPlot->yAxis->setTickLabels(false);
    customPlot->yAxis->setSubTickLength(0);
    customPlot->yAxis->setTickLength(0);
    customPlot->yAxis->setRange(-1.6,1.6);
    customPlot->yAxis->ticker()->setTickCount(3);
    customPlot->yAxis->grid()->setPen(QPen(Qt::white));

    //y2轴设置
    customPlot->yAxis2->setVisible(true);
    customPlot->yAxis2->setTickLabels(false);
    customPlot->yAxis2->setSubTickLength(0);
    customPlot->yAxis2->setTickLength(0);

    //设置文本框
    maxLabel = new QCPItemText(customPlot);   //在QCustomplot中新建文字框
    maxLabel->position->setType(QCPItemPosition::ptAxisRectRatio);   //位置类型
    maxLabel->position->setCoords(0.96,0.18);
    maxLabel->setText("1.00");
    maxLabel->setColor(QColor(Qt::white));   //字体颜色
    maxLabel->setFont(QFont(font().family(),8));   //字体大小
    maxLabel->setBrush(QColor(Qt::red));
    maxLabel->setPadding(QMargins(2,2,2,2));   //文字距离边框几个像素

    minLabel = new QCPItemText(customPlot);
    minLabel->position->setType(QCPItemPosition::ptAxisRectRatio);
    minLabel->position->setCoords(0.96,0.82);
    minLabel->setText("-1.00");
    minLabel->setColor(QColor(Qt::white));
    minLabel->setFont(QFont(font().family(),8));
    minLabel->setBrush(QColor(Qt::red));
    minLabel->setPadding(QMargins(2,2,2,2));

    //绘制柱状图
    QCPBars *bars = new QCPBars(customPlot->xAxis,customPlot->yAxis);
    bars->setAntialiased(false);   //为了更好的边框效果,关闭抗齿锯
    bars->setPen(QPen(QColor(Qt::green).lighter(100)));   //设置柱状图的边框颜色
    bars->setWidth(1);   //设置各柱之前无间隔
    bars->setBrush(QColor(Qt::green));    //绿色
    QVector<double> ticks1;
    ticks1 << 0.5 << 2.5 << 3.5 << 4.5;
    QVector<double> fossilData1;
    fossilData1  << -1 << 0.1 << 0.8 << -0.2;
    bars->setData(ticks1,fossilData1);

    //bars->setBrush(QColor(Qt::yellow));   //黄色

    QCPBars *bars2 = new QCPBars(customPlot->xAxis,customPlot->yAxis);
    bars2->setAntialiased(false);
    bars2->setPen(QPen(QColor(Qt::red).lighter(100)));
    bars2->setWidth(1);
    bars2->setBrush(QColor(Qt::red));      //红色
    QVector<double> ticks2;
    ticks2 << 1.5 << 5.5 << 6.5;
    QVector<double> fossilData2;
    fossilData2  << 2.5 << -1.5 << 1.2;
    bars2->setData(ticks2,fossilData2);
}

void Widget::on_pb_Test_clicked()
{


    m_customPlot = new QCustomPlot();
    m_customPlot = ui->customplot;
    setBarCustomPlot(m_customPlot);
    m_customPlot->replot(QCustomPlot::rpQueuedReplot);
}
3.widget.ui见上文。
总结
在进行本文示例编写的时候,使用customPlot->xAxis->setPadding(10)时遇到轴边距无法修改,后面才发现qcustomplot.cpp源码中对轴边距有默认最小值为15的设置,所以为了使得轴边距可以变得更小,需要对源码中默认值进行修改(本文示例就修改为了setMinimumMargins(QMargins(5, 5, 5, 5));//qcustomplot.cpp第17598行)。
这里实现了一个比较简单的定制版的柱形图绘制,是我项目开发中需要用到的一个小组件,也让我学习了QCustomPlot图形库绘制柱形图的用法,希望可以给大家带来帮助。
本系列文章下一篇:(四)QCustomPlot柱形图动态显示实例开发
hello:
共同学习,共同进步,如果还有相关问题,可在评论区留言进行讨论。