系列文章目录
提示:这里是该系列文章的所有文章的目录
第一章: (一)QCustomPlot常见属性设置、多曲线绘制、动态曲线绘制、生成游标、矩形放大等功能实现
第二章: (二)QCustomPlot生成热力图/矩阵颜色图
第三章: (三)Qt+QCustomPlot生成上下方向/不同颜色的条形图(柱形图)
第四章 :(四)QCustomPlot柱形图动态显示实例开发
前言
接上一篇文章,在前文中实现的一个柱形图数据都是固定的,无法通过模拟按钮来进行数据的增加,并且数据量较小,无法体现实际项目中所需要的功能。所以在这一篇文章中进行了数据的模拟增加,并且可以动态显示界面,也可以清空图表进行重绘,详细功能实现见文章内容,大家可以参考学习,如有错误之处,欢迎大家批评指正。
项目效果
提示:以下是本篇文章正文内容,下面案例可供参考
一、QCustomPlot的提升
本文在ui界面上添加了两个widget控件,并将其提升为QCustomPlot类,具体的提升步骤可见此博客:QCustomPlot常见属性设置、多曲线绘制、动态曲线绘制、生成游标、矩形放大等功能实现
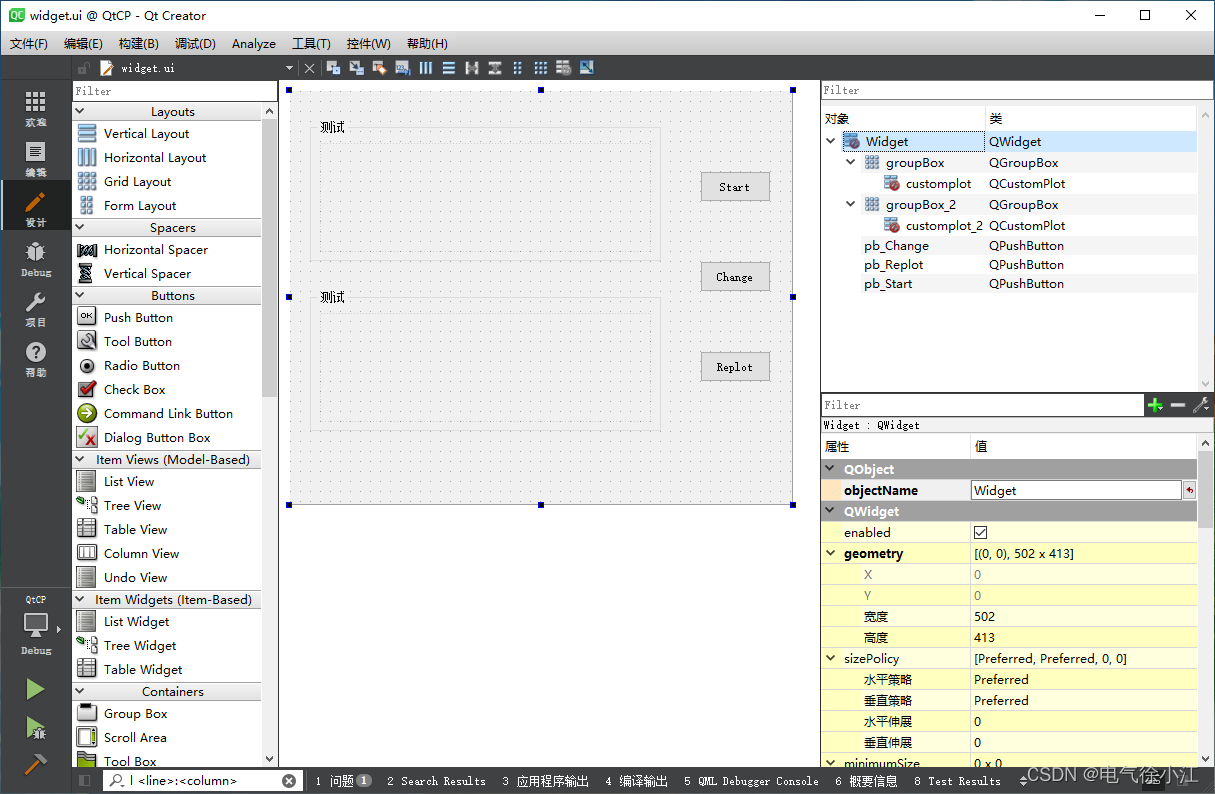
由于界面上有多个QCustomPlot,所以在我们的构造函数中需要对这两个控件进行初始化,两个控件背景等等都是一样的,所以这里使用了一个setBarCustomPlot()函数通过输入形参的方式来完成两个控件的初始化,见下文示例完整代码。
void Widget::initWidget()
{


	...
	m_customPlot = new QCustomPlot();
    m_customPlot = ui->customplot;
    setBarCustomPlot(m_customPlot,0);

    m_customPlot_2 = new QCustomPlot();
    m_customPlot_2 = ui->customplot_2;
    setBarCustomPlot(m_customPlot_2,1);
    ...
二、示例完整代码展示
这里将示例的完整代码进行展示,详情见代码注释
1.widget.h
#ifndef WIDGET_H
#define WIDGET_H

#include <QWidget>
#include "CustomPlot/qcustomplot.h"

QT_BEGIN_NAMESPACE
namespace Ui {

     class Widget; }
QT_END_NAMESPACE

class Widget : public QWidget
{


    Q_OBJECT

public:
    Widget(QWidget *parent = nullptr);
    ~Widget();

    void initWidget();
    void setBarCustomPlot(QCustomPlot *customPlot,int index);
    void setBarReplot(QCustomPlot *customPlot);

protected:
    bool eventFilter(QObject *watched,QEvent *event);

private slots:
    void on_pb_Start_clicked();
    void on_pb_Replot_clicked();
    void on_pb_Change_clicked();

private:
    Ui::Widget *ui;

    QCustomPlot *m_customPlot;
    QCustomPlot *m_customPlot_2;
    QCPItemText *maxLabel[2];
    QCPItemText *minLabel[2];

    int serialNum;
    double maxNum;
    double minNum;
    double xNum;
    double yNum;
};
#endif // WIDGET_H
2.widget.cpp
#include "widget.h"
#include "ui_widget.h"

Widget::Widget(QWidget *parent)
    : QWidget(parent)
    , ui(new Ui::Widget)
{


    ui->setupUi(this);
    this->initWidget();
}

Widget::~Widget()
{


    delete m_customPlot;
    delete ui;
}

void Widget::initWidget()
{


    //初始化变量
    serialNum = 0;
    maxNum = 0;
    minNum = 0;
    xNum = 0;
    yNum = 0;

    m_customPlot = new QCustomPlot();
    m_customPlot = ui->customplot;
    setBarCustomPlot(m_customPlot,0);

    m_customPlot_2 = new QCustomPlot();
    m_customPlot_2 = ui->customplot_2;
    setBarCustomPlot(m_customPlot_2,1);

    //添加事件过滤器
    ui->customplot->installEventFilter(this);
    ui->customplot_2->installEventFilter(this);
}

void Widget::setBarCustomPlot(QCustomPlot *customPlot,int index)
{


    //qDebug()<<"*customPlot:"<<customPlot->objectName();

    //设置背景黑色
    customPlot->axisRect()->setBackground(QBrush(Qt::black));

    //x轴设置
    customPlot->xAxis->setVisible(true);
    customPlot->xAxis->setTickLabels(false);
    customPlot->xAxis->setSubTickLength(0);
    customPlot->xAxis->setTickLength(0);
    customPlot->xAxis->setRange(0,30);

    //x2轴设置
    customPlot->xAxis2->setVisible(true);
    customPlot->xAxis2->setTickLabels(false);
    customPlot->xAxis2->setSubTickLength(0);
    customPlot->xAxis2->setTickLength(0);

    //y轴设置
    customPlot->yAxis->setVisible(true);
    customPlot->yAxis->setTickLabels(false);
    customPlot->yAxis->setSubTickLength(0);
    customPlot->yAxis->setTickLength(0);
    customPlot->yAxis->setRange(-1.6,1.6);
    customPlot->yAxis->ticker()->setTickCount(3);
    customPlot->yAxis->grid()->setPen(QPen(Qt::white));

    //y2轴设置
    customPlot->yAxis2->setVisible(true);
    customPlot->yAxis2->setTickLabels(false);
    customPlot->yAxis2->setSubTickLength(0);
    customPlot->yAxis2->setTickLength(0);

    //设置文本框
    maxLabel[index] = new QCPItemText(customPlot);   //在QCustomplot中新建文字框
    maxLabel[index]->position->setType(QCPItemPosition::ptAxisRectRatio);   //位置类型
    maxLabel[index]->position->setCoords(0.96,0.18);
    maxLabel[index]->setText("   ");
    maxLabel[index]->setColor(QColor(Qt::white));   //字体颜色
    maxLabel[index]->setFont(QFont(font().family(),8));   //字体大小
    maxLabel[index]->setBrush(QColor(Qt::red));
    maxLabel[index]->setPadding(QMargins(2,2,2,2));   //文字距离边框几个像素

    minLabel[index] = new QCPItemText(customPlot);
    minLabel[index]->position->setType(QCPItemPosition::ptAxisRectRatio);
    minLabel[index]->position->setCoords(0.96,0.82);
    minLabel[index]->setText("   ");
    minLabel[index]->setColor(QColor(Qt::white));
    minLabel[index]->setFont(QFont(font().family(),8));
    minLabel[index]->setBrush(QColor(Qt::red));
    minLabel[index]->setPadding(QMargins(2,2,2,2));

}

void Widget::setBarReplot(QCustomPlot *customPlot)
{


    QCPBars *bars = new QCPBars(customPlot->xAxis,customPlot->yAxis);
    bars->setAntialiased(false);   //为了更好的边框效果,关闭抗齿锯
    bars->setWidth(1);   //设置各柱之前无间隔
    bars->setPen(QPen(QColor(Qt::black).lighter(100)));   //设置柱状图的边框颜色
    qDebug()<<"maxNum:"<<maxNum<<"   minNum:"<<minNum;

    if((yNum>minNum*0.8)&&(yNum<maxNum*0.8))
    {


        bars->setBrush(QColor(Qt::green));//绿色
    }
    else if((yNum<minNum)||(yNum>maxNum))
    {


        bars->setBrush(QColor(Qt::red));//红色
    }
    else
    {


        bars->setBrush(QColor(Qt::yellow));//黄色
    }

    QVector<double> ticks1;
    ticks1 << xNum;
    QVector<double> fossilData1;
    fossilData1  << yNum;
    bars->setData(ticks1,fossilData1,true);

    if(xNum > 30)
    {


        customPlot->xAxis->setRange(xNum-29.5,xNum+0.5);
    }

    customPlot->replot(QCustomPlot::rpQueuedReplot);
}

bool Widget::eventFilter(QObject *watched, QEvent *event)
{


    if(event->type() == QEvent::MouseButtonDblClick)   //双击图表事件
    {


        if(watched == ui->customplot)
        {


            qDebug()<<"customplot doubleClicked";
        }
        else if(watched == ui->customplot_2)
        {


            qDebug()<<"customplot_2 doubleClicked";
        }
    }
    return QWidget::eventFilter(watched,event);
}

void Widget::on_pb_Start_clicked()
{


    //maxLabel[0]->setText("-1.11");
    //minLabel[0]->setText("-1.11");
    maxLabel[0]->setText(QString::number(maxNum,'f',2));
    minLabel[0]->setText(QString::number(minNum,'f',2));
    maxLabel[1]->setText(QString::number(maxNum,'f',2));
    minLabel[1]->setText(QString::number(minNum,'f',2));

    serialNum ++;
    qDebug()<<"serialNum:"<<serialNum;
    xNum = serialNum - 0.5;
    if(yNum < 1.5)
    {


        yNum += 0.1;
    }
    else
    {


        yNum = -1.5;
    }
    qDebug()<<"xNum:"<<xNum<<"   yNum:"<<yNum;

    setBarReplot(m_customPlot);
    setBarReplot(m_customPlot_2);
}

void Widget::on_pb_Replot_clicked()
{


    //清除数据
    serialNum = 0;
    maxNum = 0;
    minNum = 0;
    xNum = 0;
    yNum = 0;
    maxLabel[0]->setText("   ");
    minLabel[0]->setText("   ");
    maxLabel[1]->setText("   ");
    minLabel[1]->setText("   ");
    m_customPlot->xAxis->setRange(0,30);
    m_customPlot->clearPlottables();
    m_customPlot->replot(QCustomPlot::rpQueuedReplot);
    m_customPlot_2->xAxis->setRange(0,30);
    m_customPlot_2->clearPlottables();
    m_customPlot_2->replot(QCustomPlot::rpQueuedReplot);
}

void Widget::on_pb_Change_clicked()
{


    //设置文本框
    maxNum = 1.00;
    minNum = -1.00;
    maxLabel[0]->setText(QString::number(maxNum,'f',2));
    minLabel[0]->setText(QString::number(minNum,'f',2));
    maxLabel[1]->setText(QString::number(maxNum,'f',2));
    minLabel[1]->setText(QString::number(minNum,'f',2));
    m_customPlot->replot(QCustomPlot::rpQueuedReplot);
    m_customPlot_2->replot(QCustomPlot::rpQueuedReplot);
}
3.widget.ui见上文。
三、下载链接
我的示例百度网盘链接:https://pan.baidu.com/s/1IAHCmKt4x14oef_09kD0Gg
提取码:xxcj
总结
测试发现多个QCustomPlot同时显示也是很流畅的,不会造成界面卡顿啥的,文中实现界面动态显示的关键是这句代码customPlot->xAxis->setRange(xNum-29.5,xNum+0.5),大家可以根据实际进行图表X轴范围的修改。在实际工作中可能还会遇到点击QCustomPlot界面来实现其他的功能,这时候可以考虑使用事件过滤器的方法,文中进行了双击图表的事件重写,可以根据项目需要进行更改。
本系列文章上一篇:(三)Qt+QCustomPlot生成上下方向/不同颜色的条形图(柱形图)
hello:
共同学习,共同进步,如果还有相关问题,可在评论区留言进行讨论。