# Dplyr for data wrangling and pipe function
library(dplyr)
# Load geosphere
library(geosphere)
library(maps)
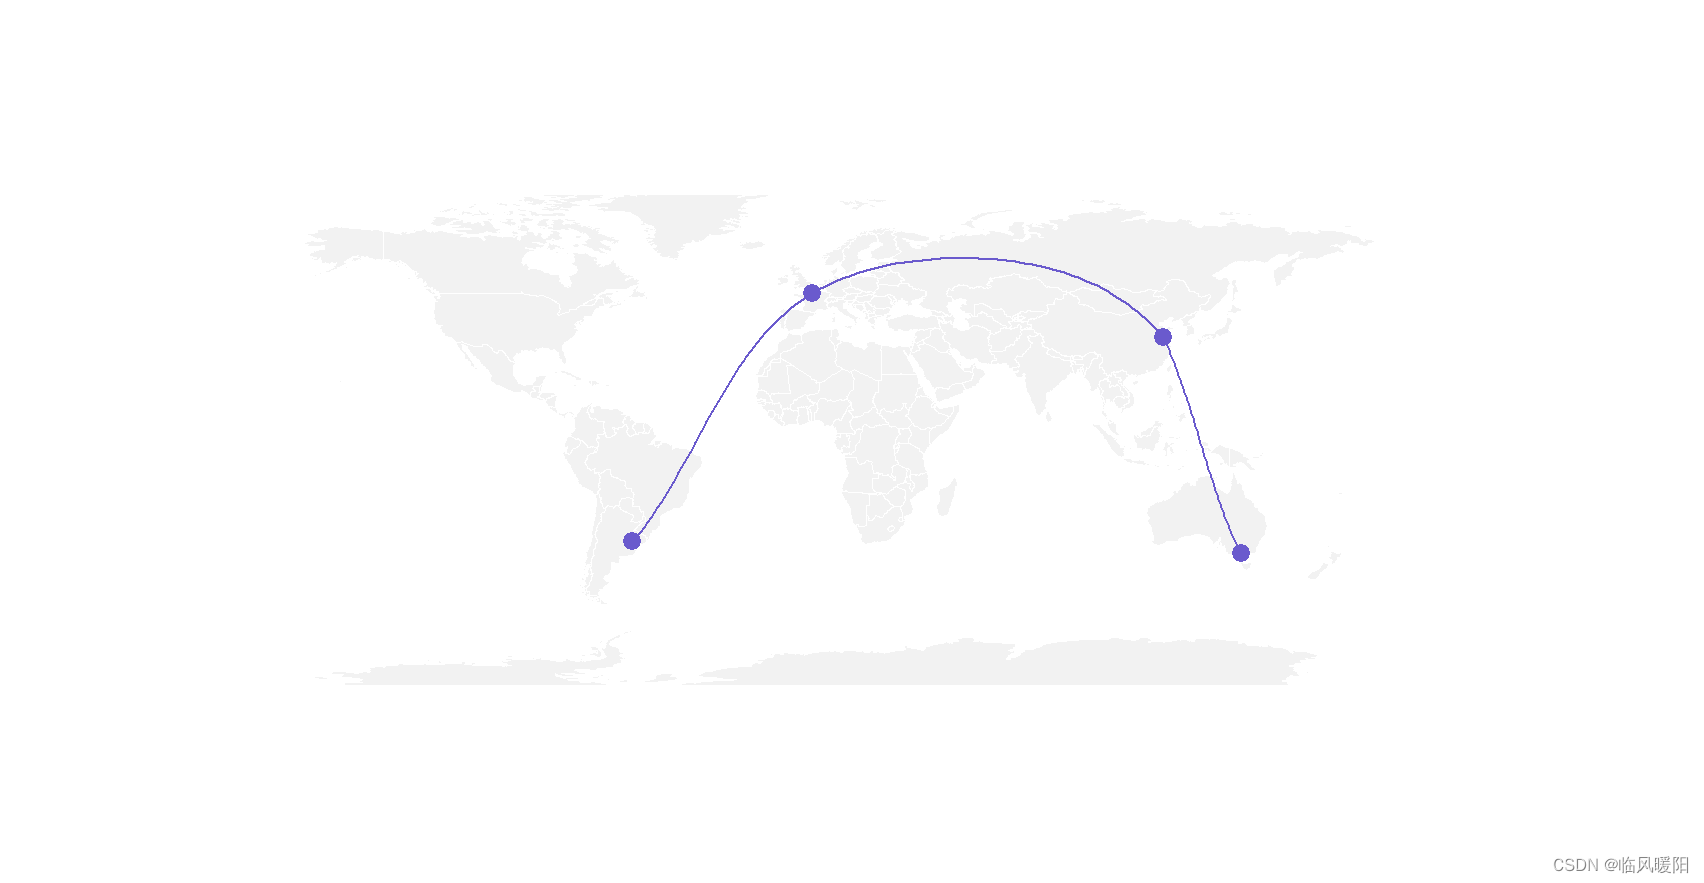
# Background map
map('world',
col="#f2f2f2", fill=TRUE, bg="white", lwd=0.05,
mar=rep(0,4),border=0, ylim=c(-80,80)
)
# Cities
Buenos_aires <- c(-58,-34)
Paris <- c(2,49)
Melbourne <- c(145,-38)
ShuYang=c(119.10,34.25)
# Dot for cities
#points(x=data$long, y=data$lat, col="slateblue", cex=3, pch=20)
# Compute the connection between Buenos Aires and Paris
inter <- gcIntermediate(Paris, Buenos_aires, n=50, addStartEnd=TRUE, breakAtDateLine=F)
# Data frame
data <- rbind(Buenos_aires, Paris, Melbourne,ShuYang) %>%
as.data.frame()
colnames(data) <- c("long","lat")
# Show the cities on the map
map('world',
col="#f2f2f2", fill=TRUE, bg="white", lwd=0.05,
mar=rep(0,4),border=0, ylim=c(-80,80)
)
points(x=data$long, y=data$lat, col="slateblue", cex=3, pch=20)
# Show this connection
lines(inter, col="slateblue", lwd=2)
# Between Paris and ShuYang
inter <- gcIntermediate(ShuYang, Paris, n=50, addStartEnd=TRUE, breakAtDateLine=F)
lines(inter, col="slateblue", lwd=2)
# Between Melbourne and ShuYang
inter <- gcIntermediate(Melbourne, ShuYang, n=50, addStartEnd=TRUE, breakAtDateLine=F)
lines(inter, col="slateblue", lwd=2)
开发工具:RStudio
微信Alt+A截屏工具