matplotlib摘要
Matplotlib
import matploblib.pyplot as pltParts of Figure
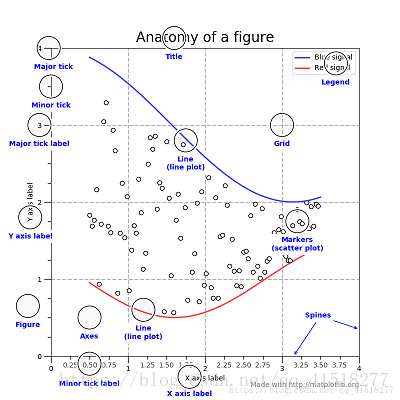
一般通过get_<part>方法获得组件属性,set_<part>方法重设组件。
Workflow
- Step 1 Prepare data
- Step 2 Create figure
- Step 3 Add axes
- Step 4 Customize plot
- Step 5 Save plot
- Step 6 Show plot
>>> import matplotlib.pyplot as plt
>>> x = [1,2,3,4]
>>> y = [10,20,25,30]
>>> fig = plt.figure()
>>> ax = fig.add_subplot(111)
>>> ax.plot(x, y, color='lightblue', linewidth=3)
>>> ax.set_xlim(1, 6.5)
>>> plt.savefig('foo.png')
>>> plt.show()
Figure and Axes
plt.subplots
plt.subplots(nrows=1, ncols=1, sharex=False, sharey=False,...) Create a figure and a set of subplots
Parameters:
nrows, ncols : (int) 分割figure行数和列数
sharex, sharey : bool or {‘none’, ‘all’, ‘row’, ‘col’}, 是否共享坐标轴
>>> fig, ax = plt.subplots()
>>> f, (ax1, ax2) = plt.subplots(1, 2, sharey=True)
Create Figure
plt.figure(num=None, figsize=None, dpi=None, facecolor=None, edgecolor,...)
Parameters:
num : (integer or string) figure编号
figsize : (tuple of integers) figure尺寸
dpi : (integer) 分辨率
Add Axes
fig.add_subplot(nrows, ncols, plot_number)
nrows, ncols, plot_number: 分割figure行数和列数,axes的位置
fig.add_axes(rect) 可以添加图中图
Parameters:
rect : [left, bottom, width, height]
projection : [‘aitoff’ | ‘hammer’ | ‘lambert’ | ‘mollweide’ | ‘polar’ | ‘rectilinear’], optional
polar : boolean, optional
plt.subplot2grid(shape, loc, rowspan=1, colspan=1) 建造不规则axes
Parameters:
shape: figue分割
loc: 原点位置,基于shape分割结果
rowspan, colspan: 行或列的跨度
ax1 = plt.subplot2grid((3,3), (0,0), colspan=3)
ax2 = plt.subplot2grid((3,3), (1,0), colspan=2)
ax3 = plt.subplot2grid((3,3), (1, 2), rowspan=2)
ax4 = plt.subplot2grid((3,3), (2, 0))
ax5 = plt.subplot2grid((3,3), (2, 1))
plt.suptitle("subplot2grid") 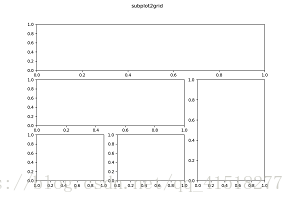
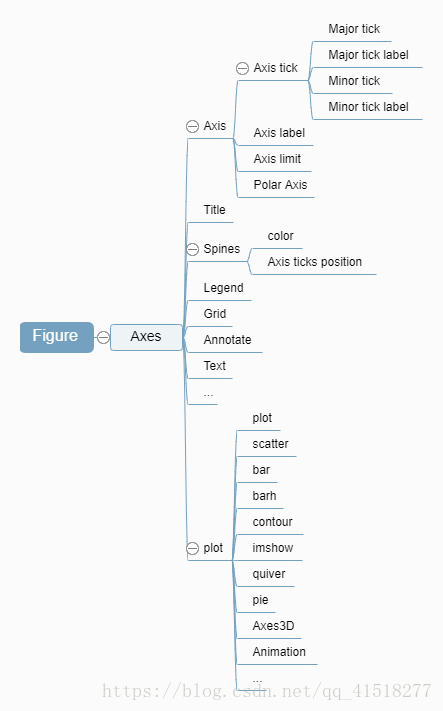
Parts of Axes
| Axis(x axis) | 说明 |
|---|---|
| ax.set_xlabel(xlabel, fontdict=None, labelpad=None) | x轴标签 |
| ax.set_xticks(ticks, minor=False) | 刻度 |
| ax.set_xticklabels(labels, fontdict=None, minor=False) | x轴刻度标签 |
| ax.set_xlim(left=None, right=None) | x轴限制 |
| ax.set_title(label, fontdict=None, loc=’center’) | loc : {‘center’, ‘left’, ‘right’}, str, optional |
# x轴刻度标签属性设置,其他组件属性设置基本相同
xlabel=ax.get_xticklabels()
label.set_fontsize(...)
label.set_bbox(...)
Spines
ax.spines['left'].set_color('b') # 左侧线条修改为蓝色
ax.spines['top'].set_visible(False) # 使顶层线条不可见
ax.spines['bottom'].set_position(('outward',10) # 使底层线条外移10
spines: {left,right,top,bottom}
Legend
ax.legend(loc='best', handles,labels)
handles:图例控制对象
labels:图例标签
loc: string or 0:10
Grid
ax.grid(b=None, which='major', axis='both')
Parameters:
which: ‘major’ (default), ‘minor’, or ‘both’
axis: ‘both’ (default), ‘x’, or ‘y’
annotate and Text
ax.annotate()
Parameters:
s : str
xy : iterable
xytext : iterable, optional
xycoords : str, Artist, Transform, callable or tuple, optional
textcoords : str,Artist,Transform, callable or tuple, optional
fontsize:
arrowprops : dict, optional
ax.text(x, y, s, fontdict=None, withdash=False)
Plot
| 常用图形 | 说明 |
|---|---|
| plot(x,y,data) | 默认折线图 |
| scatter(x, y, s, c, marker, cmap) | 散点图{s:size,c:color} |
| hist(x, bins) | 直方图 |
| bar(x, height, width, fill) | 柱状图 |
| barh(y, height, width, fill) | 横向柱状图 |
| boxplot(y) | 箱线图 |
| violinplot(y) | |
| contourf(X,Y,Z,N,cmap) | 等高线填充 |
| contour(X,Y,Z,N) | 等高线线条 |
| imshow() | 热图 |
| quiver() | 矢量场 |
| pie(x, explode, labels, colors) | 饼图 |
Parameters:
Alpha
Colors, Color Bars & Color Maps
Markers: marker , size
Line: linestyle, linewidth
Axes3D
from matplotlib import cm
from mpl_toolkits.mplot3d import Axes3D

X = np.arange(-5, 5, 0.25)
Y = np.arange(-5, 5, 0.25)
X, Y = np.meshgrid(X, Y)
R = np.sqrt(X**2 + Y**2)
Z = np.sin(R)

fig = plt.figure()
ax = Axes3D(fig)
ax.plot_surface(X, Y, Z, rstride=1, cstride=1, cmap=cm.viridis)
plt.show()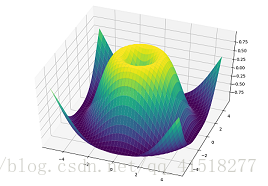
Animation
import matplotlib.animation as animation

fig, ax = plt.subplots()
x = np.arange(0, 2*np.pi, 0.01)
line, = ax.plot(x, np.sin(x))
def init():  # only required for blitting to give a clean slate.
    line.set_ydata([np.nan] * len(x))
    return line,
def animate(i):
    line.set_ydata(np.sin(x + i / 100))  # update the data.
    return line,
ani = animation.FuncAnimation(
    fig, animate, init_func=init, interval=2, blit=True, save_count=50)
plt.show()
Save and Show
fig.savefig(fname) # or plt.savefig
fig.show(warn=True) # or plt.show