一、简单表格制作
Latex表格需要用到 table 和 tabular 环境。其中 table 环境里写表格的标题(caption)、表格的位置之类的。 tabular 环境则是绘制表格的内容。一个简单的表格绘制代码如下所示:
\documentclass{

    article}

\begin{

    document}

\begin{

    table}[h!]
  \begin{

    center}
    \caption{

    Your first table.}
    \begin{

    tabular}{

    l|c|r} % <-- Alignments: 1st column left, 2nd middle and 3rd right, with vertical lines in between
      \textbf{

    Value 1} & \textbf{

    Value 2} & \textbf{

    Value 3}\\
      $\alpha$ & $\beta$ & $\gamma$ \\
      \hline
      1 & 1110.1 & a\\
      2 & 10.1 & b\\
      3 & 23.113231 & c\\
    \end{

    tabular}
  \end{

    center}
\end{

    table}

\end{

    document}
结果如下:
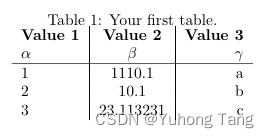
首先是 table 环境部分,\begin{center}让表格居中,\caption{Your first table.}写表格的标题。
然后是 tabular 环境部分,\begin{tabular}{l|c|r}这里面的{l|c|r},包含了三个字母,代表了表格总共有三列,第一列靠左偏移,第二列居中,第三列靠右偏移。竖线代表列之间用线分隔开来,如果想要左右两边都用线包围起来,应该改成{|l|c|r|}。接下来就是正式的表格绘制部分。
Latex里的表格是一行行来绘制的,每一行里面用&来分隔各个元素,用\\来结束当前这一行的绘制。代码中\textbf{Value 1} & \textbf{Value 2} & \textbf{Value 3}\\绘制表格的第一行,是三个加粗的字符串。第二行$\alpha$ & $\beta$ & $\gamma$ \\则是三个希腊字符。
接着是\hline,它的作用是画一整条横线,注意如果想画一条只经过部分列的横线,则可以用cline{a-b},代表的是画一条从第a列到第b列的横线。
二、表格单元占据多个行或者列
表格单元占据多个行或者列需要用到multirow和multicolumn,首先要引入相关的包:
%...
\usepackage{

    multirow} % Required for multirows
\begin{

    document}
%...
multirow和multicolumn的格式如下:
\multirow{

    NUMBER_OF_ROWS}{

    WIDTH}{

    CONTENT}
NUMBER_OF_ROWS代表该表格单元占据的行数,WIDTH代表表格的宽度,一般填 * 代表自动宽度,CONTENT则是表格单元里的内容。
\multicolumn{

    NUMBER_OF_COLUMNS}{

    ALIGNMENT}{

    CONTENT}
NUMBER_OF_COLUMNS代表该表格单元占据的列数,ALIGNMENT代表表格内容的偏移(填l,c或者r),CONTENT则是表格单元里的内容。
2. 1 一个multirow的例子
\begin{

    table}[h!]
  \begin{

    center}
    \caption{

    Multirow table.}
    \label{

    tab:table1}
    \begin{

    tabular}{

    l|S|r}
      \textbf{

    Value 1} & \textbf{

    Value 2} & \textbf{

    Value 3}\\
      $\alpha$ & $\beta$ & $\gamma$ \\
      \hline
      \multirow{

    2}{

    *}{

    12} & 1110.1 & a\\ % <-- Combining 2 rows with arbitrary with (*) and content 12
      & 10.1 & b\\ % <-- Content of first column omitted.
      \hline
      3 & 23.113231 & c\\
      4 & 25.113231 & d\\
    \end{

    tabular}
  \end{

    center}
\end{

    table}
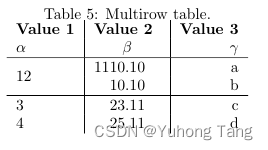
主要是这一句代码\multirow{2}{*}{12} & 1110.1 & a\\,使得内容为 12 的这一个表格单元占据了两行。注意的是,下一行的第一个位置,由于已经被 12 这个单元给占据了,因此第二行的代码是& 10.1 & b\\,这里第一个位置没有写东西,如果写了东西会使得这一行超过3列,表格错位。
2.2 一个multicolumn的例子
\begin{

    table}[h!]
  \begin{

    center}
    \caption{

    Multicolumn table.}
    \label{

    tab:table1}
    \begin{

    tabular}{

    l|S|r}
      \textbf{

    Value 1} & \textbf{

    Value 2} & \textbf{

    Value 3}\\
      $\alpha$ & $\beta$ & $\gamma$ \\
      \hline
      \multicolumn{

    2}{

    c|}{

    12} & a\\ % <-- Combining two cells with alignment c| and content 12.
      \hline
      2 & 10.1 & b\\
      3 & 23.113231 & c\\
      4 & 25.113231 & d\\
    \end{

    tabular}
  \end{

    center}
\end{

    table}
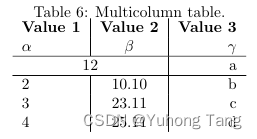
这里主要是这一句代码\multicolumn{2}{c|}{12} & a\\,使得内容为 12 的这一个表格单元占据了两列。所以这一行接下来只能填一个元素a。注意这里的ALIGNMENT写的是c|代表表格内容居中,表格右侧有竖线而左侧没有。
2.3 结合multirow与multicolumn
单元格需要同时占据两行和两列,其实只需要把\multirow{NUMBER_OF_ROWS}{WIDTH}{CONTENT}的CONTENT写成multicolumn就可以了。
\begin{

    table}[h!]
  \begin{

    center}
    \caption{

    Multirow and -column table.}
    \label{

    tab:table1}
    \begin{

    tabular}{

    l|S|r}
      \textbf{

    Value 1} & \textbf{

    Value 2} & \textbf{

    Value 3}\\
      $\alpha$ & $\beta$ & $\gamma$ \\
      \hline
      \multicolumn{

    2}{

    c|}{

    \multirow{

    2}{

    *}{

    1234}} & a\\ % <-- Multicolumn spanning 2 columns, content multirow spanning two rows
      \multicolumn{

    2}{

    c|}{

    } & b\\ % <-- Multicolumn spanning 2 columns with empty content as placeholder
      \hline
      3 & 23.113231 & c\\
      4 & 25.113231 & d\\
    \end{

    tabular}
  \end{

    center}
\end{

    table}
 最主要的语句
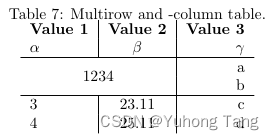
\multicolumn{2}{c|}{\multirow{2}{*}{1234}} & a\\使得内容为1234的表格单元占据了2行两列,所以当前这一行右边只能再写一个元素a了,然后注意的是下一行是\multicolumn{2}{c|}{} & b\\用一个空的multicolumn来代表前两个位置空置,然后填剩下的一个元素b。
三、复杂表格实例
\begin{

    table*}[t]
\centering
\caption{

    MAP scores of teacher model, different student models with 4 widths and three baseline models with different length of binary codes on CIFAR-10 and SUN datasets.}
\label{

    table1}
\begin{

    tabular}{

    |c|c|c|c|c|c|c|c|c|c|c|c|}
\hline
\multicolumn{

    2}{

    |c|}{

    \multirow{

    2}{

    *}{

    Model}} &\multirow{

    2}{

    *}{

    FLOPs}&\multirow{

    2}{

    *}{

    Params} & \multicolumn{

    4}{

    c|}{

    CIFAR-10}&\multicolumn{

    4}{

    c|}{

    SUN}\\
\cline{

    5-12}

\multicolumn{

    2}{

    |c|}{

    } & & & 12bits & 24bits & 32bits & 48bits & 12bits & 24bits & 32bits & 48bits \\
\hline

\multicolumn{

    2}{

    |c|}{

    Teacher} &4.12G	&25.56M	&0.87841	&0.89512	&0.9014	&0.90601	&0.83587	&0.85736	&0.86297	&0.87103\\
\hline

%0.25x-----------------
\multirow{

    4}{

    *}{

    $0.25\times$} & Stu-1 & 0.15G & 1.03M &
0.70746 & 0.73458 &	0.74909 &	0.75833 &	0.69618 &	0.76631 &	0.78075 &	0.78787 \\
\cline{

    2-12}

\multirow{

    4}{

    *}{

    } & Stu-2 &0.19G	&1.08M	&0.7629	&0.79111	&0.80039	&0.80519	&0.73539	&0.79714	&0.80753	&0.81195\\
\cline{

    2-12}

\multirow{

    4}{

    *}{

    } & Stu-3 &0.26G	&1.43M	&0.84684	&0.86443	&0.87384	&0.88268	&0.79284	&0.83442	&0.84350	&0.84353\\
\cline{

    2-12}

\multirow{

    4}{

    *}{

    } & Stu-4 & 0.29G	&1.99M	&0.85901	&0.87269	&0.8836	&0.88728	&0.81997	&0.84620	&0.85041	&0.85036\\
\hline
\end{

    tabular}
\label{

    table_MAP}
\end{

    table*}
输出结果为
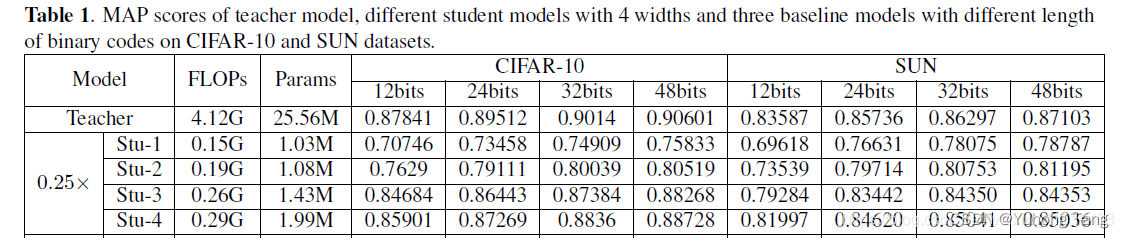
这里使用\begin{table*}[t]有一个星号,是为了让表格宽度与页面等宽而不是二分之一宽。