Motivation
用Unity来进行数字孪生,很重要的一个因素就是能够实时更新读取数据,并显示出来,为此我在Unity当中基于XChart进行了一些探索,思路是先是从CSV文件当中进行读取,后面会打算从数据库中或串口通信中实现数据的实时读取。
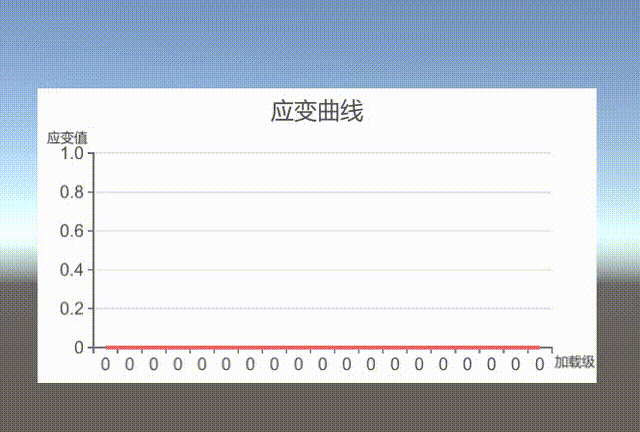
做的效果
先放效果图
目前初步实现了心电图式地实时读取和更新。
思路解析
首先我读取的csv文件的样式如下:
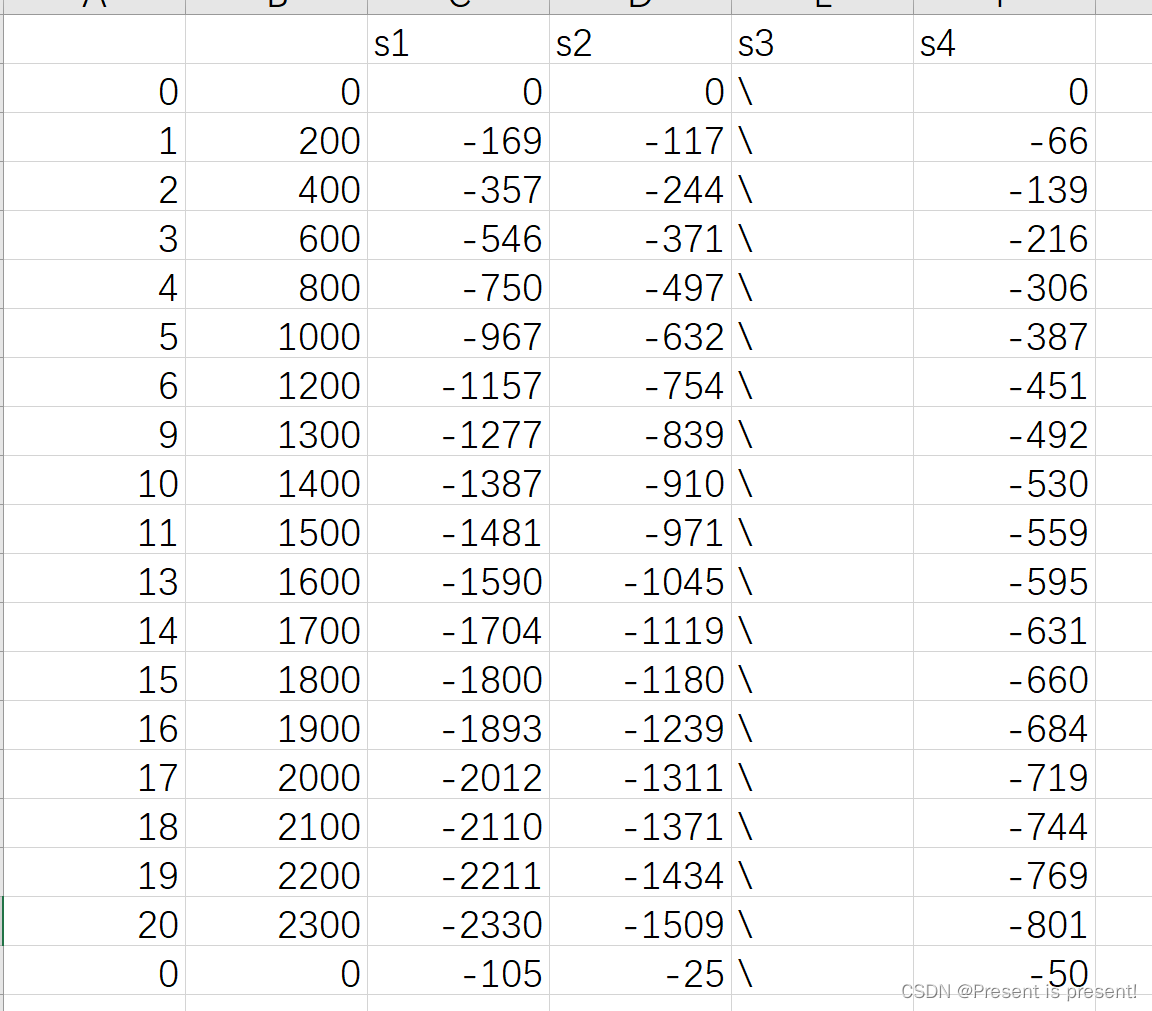
第一行是传感器编号,第一列是加载级,第二列是加载的数值。其余则是传感器数值。
在编写的过程当中,借鉴了XChart当中的例子。
在这里首先需要申请存储数据的位置,因为具有多条数据,所以这里使用了队列列表。为什么要使用队列呢? 是因为和自己想要做的效果有关系,即数据实时读取的效果。 那也就是说,在窗口的大小是固定的情况下,到一定时间之后,前面读取的数据就应该消失。这个对应着 “队列”的这样的数据结构。 这里面还有一个知识点,因为内置的Update函数执行的速率太快了,所以最好使用一个“协程” 来进行,在协程里面可以控制更新的时间。
其他就是需要比较熟悉XChart库的基本框架了,具体可以多参考一下官方给定的代码示例。
下面直接展示 代码.
#if INPUT_SYSTEM_ENABLED
using Input = XCharts.Runtime.InputHelper;
#endif
using System.Collections.Generic;
using UnityEngine;
using XCharts.Runtime;
using System.Collections;
using System;

public class FixedSizeQueue<T>:Queue<T>{
    private int maxSize;

    // 构造函数:指定固定长度的队列
    public FixedSizeQueue(int size){
        maxSize = size;
    }

    // Enqueue 方法重写
    public new void Enqueue(T obj){
        base.Enqueue(obj);
        if(Count > maxSize)
        {
            Dequeue();
        }
    }
}


[DisallowMultipleComponent]
[ExecuteInEditMode]
public class LineControl : MonoBehaviour
{
    public TextAsset csvData;
    protected SimplifiedLineChart chart;
    protected List<List<float>> sensorData;

    private int index = 0;


    // 创建一个固定长度为19的队列
    private static int  dataQueueLength = 19;

    // 假设有多组传感器数据,每组数据用一个队列来存储

    List<FixedSizeQueue<float>> sensordataList = new List<FixedSizeQueue<float>>();
    int  numOfLines = 4; //假设有4条线;
    FixedSizeQueue<int> fixedIndexQueue = new FixedSizeQueue<int>(dataQueueLength);


    void Start()
    {
        chart = gameObject.GetComponent<SimplifiedLineChart>();
        if (chart == null)
        {
            chart = gameObject.AddComponent<SimplifiedLineChart>();
            chart.Init();
            chart.SetSize(580, 300);
        }

        chart.EnsureChartComponent<Title>().show = true;
        chart.EnsureChartComponent<Title>().text = "应变曲线";

        chart.EnsureChartComponent<Tooltip>().show = true;
        chart.EnsureChartComponent<Legend>().show = true;

        var xAxis = chart.EnsureChartComponent<XAxis>();
        var yAxis = chart.EnsureChartComponent<YAxis>();
        xAxis.show = true;
        yAxis.show = true;

        xAxis.type = Axis.AxisType.Category;
        yAxis.type = Axis.AxisType.Value;

        xAxis.splitNumber = 10;
        xAxis.boundaryGap = true;

        chart.RemoveData();

        chart.AddSerie<SimplifiedLine>();
        sensorData = ReadCSVFile();

        // 向队列初始化元素
        for (int i =0; i< numOfLines; i++)
        {
            FixedSizeQueue<float> fixedQueue = new FixedSizeQueue<float>(dataQueueLength); // 每条线的队列长度为19
            for (int j = 0; j < dataQueueLength; j++)
            {
                fixedQueue.Enqueue(0f);
            }
            sensordataList.Add(fixedQueue);
        }

        // 初始化x标签元素
        for (int j = 0; j < dataQueueLength; j++)
        {
            fixedIndexQueue.Enqueue(0);
        }

        StartCoroutine(UpdateData());

    }

    IEnumerator UpdateData()
    {
        while (index < sensorData[0].Count)
        {
            // 更新x标签数据
            fixedIndexQueue.Dequeue();
            fixedIndexQueue.Enqueue(index);
            // 更新多组数据
            chart.RemoveData();
            for ( int i = 0; i < numOfLines; i++)
            {
                sensordataList[i].Dequeue();
                sensordataList[i].Enqueue(sensorData[i][index]);
                chart.AddSerie<SimplifiedLine>(); // 添加多条线
                var currentSerie = chart.GetSerie(i);
                currentSerie.animation.enable = false;

                foreach (var item in sensordataList[i])
                {
                    chart.AddData(i, item);
                }
            }
            foreach (var item in fixedIndexQueue)
            {
                chart.AddXAxisData($"{item}");
            }
            index++;
            yield return new WaitForSeconds(1f); // 等待0.1秒后再进行下一次更新
        }

    }

    List<List<float>> ReadCSVFile()
    {

        // 在这里编写读取CSV文件并填充 sensorData 列表的逻辑
        List<List<float>> sensorData = new List<List<float>>();
        // ... (读取CSV文件并处理数据,将结果存储到 sensorData)
        string[] lines = csvData.text.Split('\n');
        for (int i = 1; i < (lines.Length-1); i++) //第一行是传感器编号
        {
            string[] data = lines[i].Trim().Split(',');
            List<float> rowData = new List<float>();

            for (int j = 2; j < data.Length; j++) // 从第三列开始读取传感器数值
            {
                float value;
                if (data[j] == "\\") // 将传感器数值当中的空值进行一下预处理
                {
                    value = 0f; // 可以根据需求修改为其他值,比如 float.NaN
                }
                else if (float.TryParse(data[j], out value))
                {
                    // 数据有效,保留原值
                }
                else
                {
                    value = 0f; // 或者设定为其他值
                }
                rowData.Add(value);
            }
            sensorData.Add(rowData);
        }

        // 将数据进行一下转置
        // 获取原始数据的行数和列数
        int rows = sensorData.Count;
        int cols = sensorData[0].Count;

        // 创建一个新的列为单位的二维列表,用于存储转置后的数据
        List<List<float>> transposedData = new List<List<float>>();

        // 初始化转置后的二维列表
        for (int i = 0; i < cols; i++)
        {
            transposedData.Add(new List<float>());
        }

        // 执行数据转置
        for (int i = 0; i < rows; i++)
        {
            for (int j = 0; j < cols; j++)
            {
                transposedData[j].Add(sensorData[i][j]);
            }
        }
        return transposedData;

    }
}