一、数据读取与格式转换
1、将txt文件转换为csv文件:
import pandas as pd
import numpy as np

data_txt_train=np.loadtxt('train_20171215.txt',skiprows=1)

data_df = pd.DataFrame(data_txt_train,columns=['date','day of week','brand','cnt'],index=np.arange(n))#n为样本数

data_df.to_csv('./train.csv')
2、数据可视化
import matplotlib.pyplot as plt
import matplotlib as mpl
#设置字体及图片的正确显示
mpl.rcParams['font.sans-serif'] = [u'fangsong']
mpl.rcParams['axes.unicode_minus'] = False
#绘制普通函数图
fig,ax =plt.subplots(1)
fig.set_size_inches(50,16)
ax.plot(y)
ax.set_xlabel('data',fontsize=30)
ax.set_ylabel('cnt',fontsize=30)
ax.set_title('上牌量',fontszie=160)
ax.set_xticks(range(0,1033,344),fontsize=40)
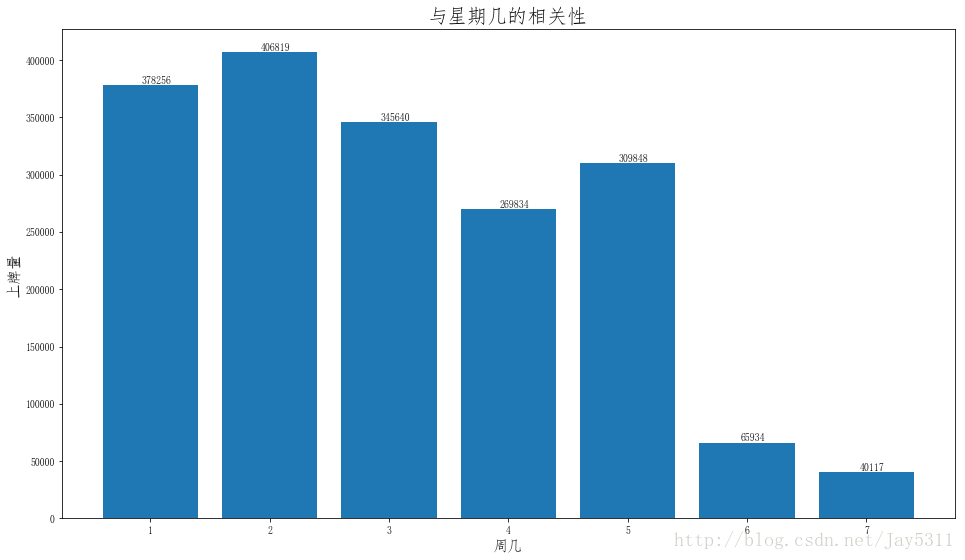
#绘制柱状图
x=data_df_week_sum.index
y=data_df_week_sum['cnt']
plt.figure(figsize=(16,9))
plt.bar(x,y)
#显示每个柱状图对应的数值
for x, y in zip(x, y):
plt.text(x + 0.05, y + 0.1, '%d' % y, ha = 'center', va = 'bottom')
plt.xlabel('周几',fontsize=15)
plt.ylabel('上牌量',fontsize=15)
plt.title('与星期几的相关性',fontsize=20)
plt.show()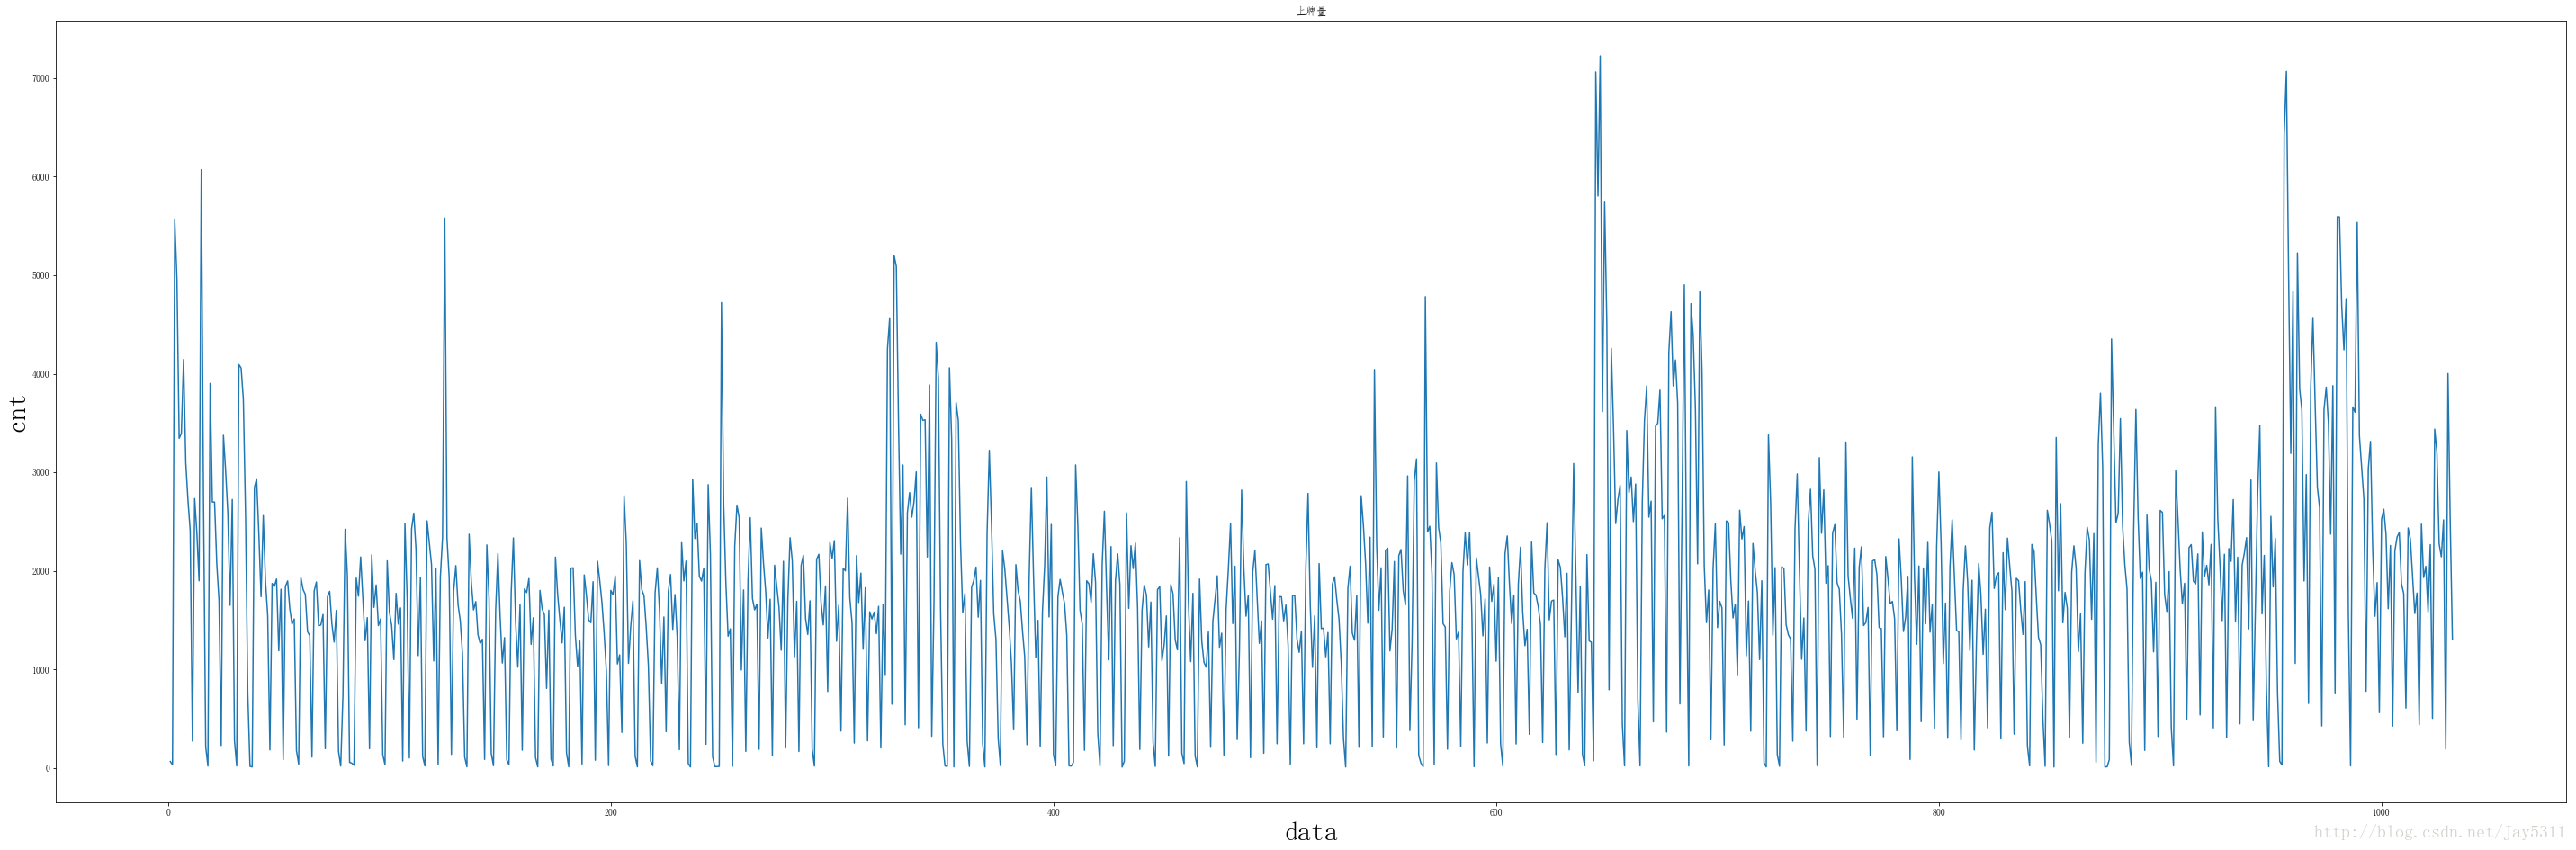
二、查询
1、Pandas中Dataframe的查询方法
    (1)[]切片方法
        使用方括号能够对DataFrame进行切片,有点类似于python的列表切片。但是只能对行切片,对列不行。
     (2)loc
        loc可以让你按照索引来进行与列选择。
     (3)iloc
        如果说loc是按照索引(index)的值来选取的话,那么iloc就是按照索引的位置来进行选取。iloc不关心索引的具体值是多少,只关心位置是多少,所以使用iloc时方括号中只能使用数值。

        # 行选择
    In [17]: data_fecha[10: 15]
        Out[17]:
                    rnd_1  rnd_2  rnd_3
        fecha
        2012-04-20     14      6     14
        2012-04-21     19     14     16
        2012-04-22      2      6     12
        2012-04-23     15      8     18
        2012-04-24     13      8     18

        # 列选择
        In [18]: data_fecha.iloc[:,[1,2]].head()
        Out[18]:
                    rnd_2  rnd_3
        fecha
        2012-04-10     17     12
        2012-04-11     16      3
        2012-04-12      6      1
        2012-04-13     16      7
        2012-04-14     17      7

        # 切片选择
        In [19]: data_fecha.iloc[[1,12,34],[0,2]]
        Out[19]:
                    rnd_1  rnd_3
        fecha
        2012-04-11      1      3
        2012-04-22      2     12
        2012-05-14     17     10
两种使用的选择方法:
for f in range(0,3):
fare[f] = data[data.Pclass == f + 1]['Fare'].dropna().median()
for f in range(0,3):
data.loc[(data.Fare == 0)&(data.Pclass == f+1),'Fare'] = fare[f]
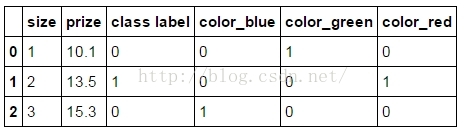
三、pandas使用get_dummies进行one-hot编码
df:
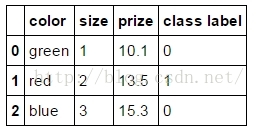
pd.get_dummies(df) :